Results for the 2nd stratification test -- 050425
This test uses the inlet tube with groups of four 1/4 inch diameter holes on 1 inch centers along the inlet tube.
First Water Add
10:57am 050425
Volume added: 2 gals at 98F
Flow rate was right at 2 gpm (a little higher than intended).
Pictures -- start about 10 sec after start of water add:
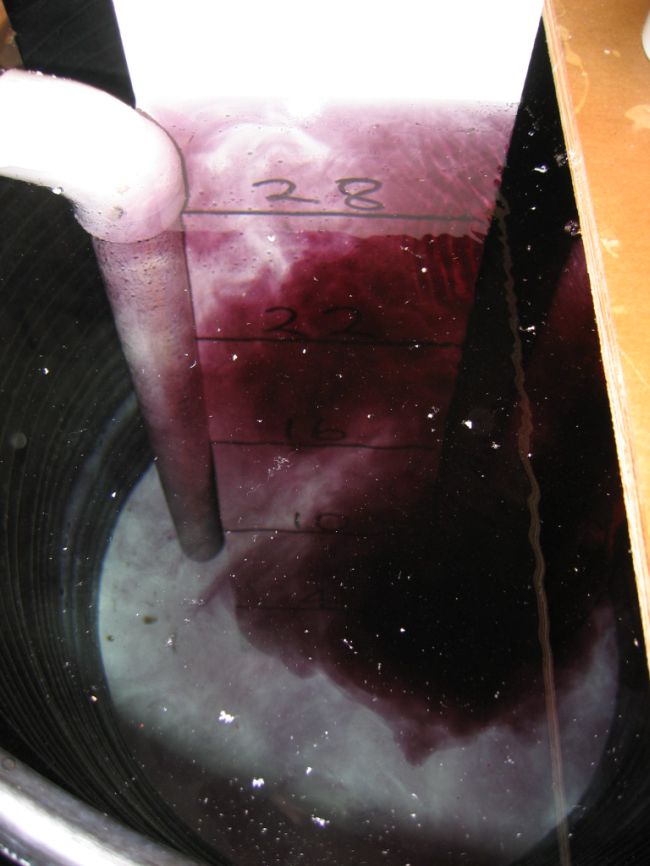
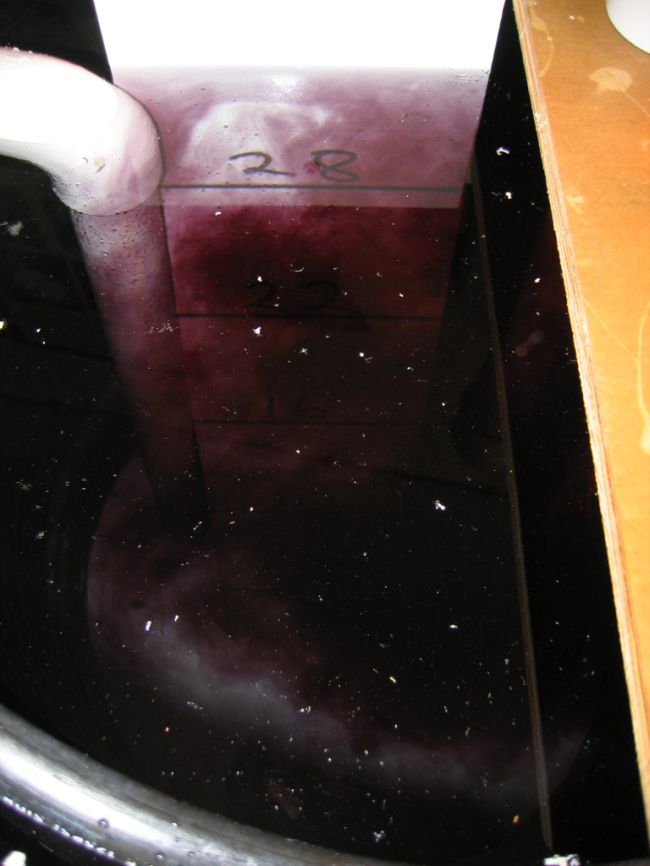
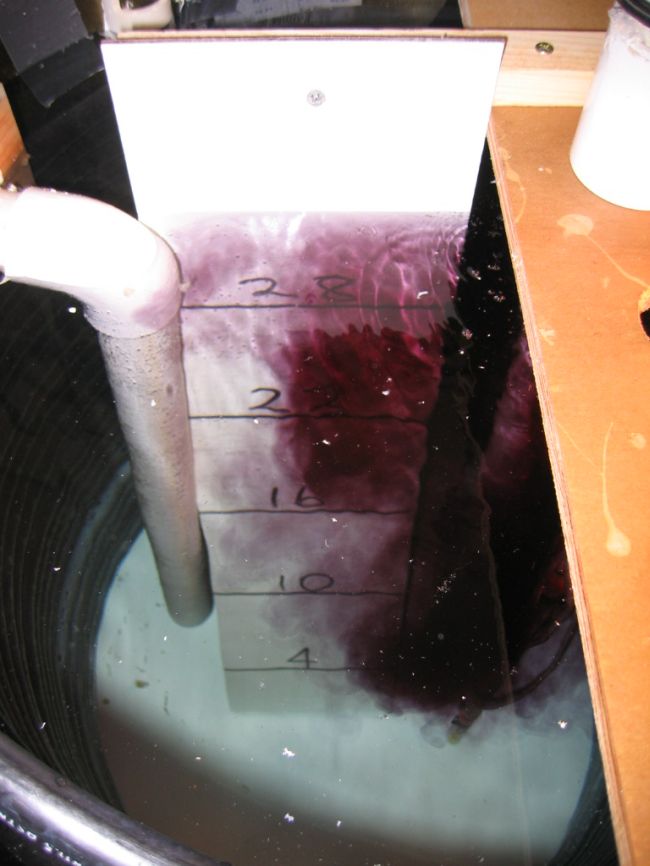
I painted the bottom of barrel white, and added a white vertical board with temperature sensor depths marked on it to make the pictures better.
Looks like on the first two that water is entering in one area centered around 22 inch line, and in another area at the bottom. By the last pic, there may be too much dye in the water to see what's going on, but still appears that it has the two area distribution.
The dye cloud centered around 22 inches is still somewhat below its thermal level in the barrel (which would be right at the top).
Temperature Plots for All Three Water Adds:
These are the plots of of barrel temps at 4, 10, 16, 22, and 28 inch levels for the three water adds.
Each add was 2 gals, temps were: 98F, 84F, and 54F.
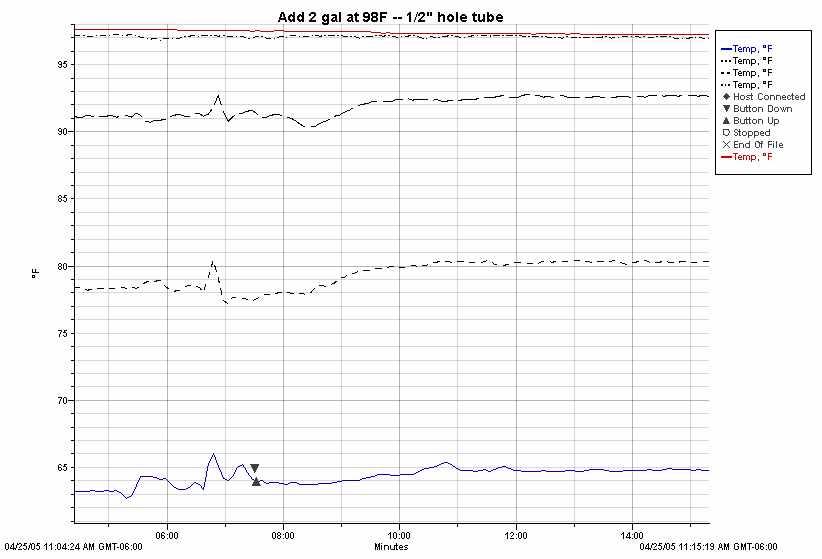
Temperature plot for 2 gals added at 98F (this one goes with the pics above). The pictures do not seem to agree well with the temp plot in that pics show dyed water entering centered around the 22 inch sensor, while the temp plot shows little change for the 22 inch sensor, and more for the 10 and 16 inch sensors ??
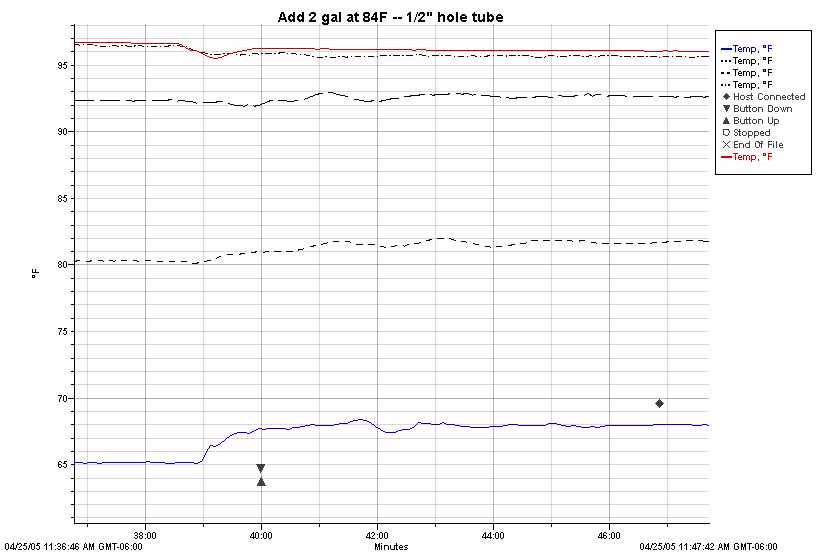
Temperature plot for 2 gals added at 84F.
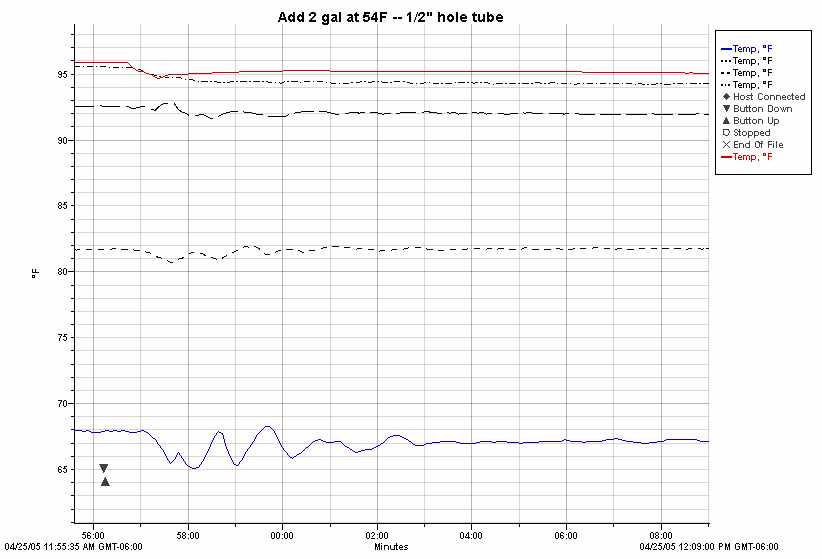
Temperature plot for 2 gals added at 54 F.
I wonder what causes the temperature oscillations from minute 58 to minute 1? They appear to be 180 out of sync at the 4 inch and 10 inch levels. The logger was set to record at 5 sec intervals, so there are quite a few points on each oscillation.
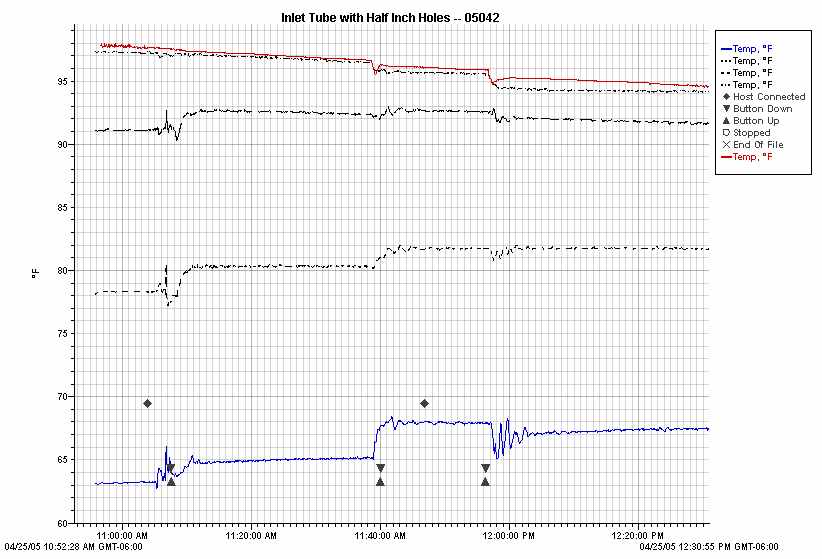
This is the plot for the whole time period showing all three water adds.
Thinking about the results:
The tables and charts below show temperature and energy change distribution for each water add.
| Quarter inch hole inlet tube test: | |||||||||
| Charts showing energy change for water add by level | |||||||||
| 98F water add -- 2 gals added at 98F | 
|
||||||||
| PreAdd | PostAdd | dTemp(F) | dEnergy(BTU) | ||||||
| 97.7 | 97.4 | -0.3 | -25.2 | ||||||
| 97.1 | 97.1 | 0 | 0 | ||||||
| 91.1 | 92.7 | 1.6 | 134.4 | ||||||
| 78.2 | 80.2 | 2 | 168 | ||||||
| 63.1 | 65 | 1.9 | 159.6 | ||||||
| 85.44 | 86.48 | 1.04 | 436.8 | ||||||
| 436.8 | |||||||||
| 84F water add -- 2 gals added at 84F | |||||||||
| PreAdd | PostAdd | dTemp(F) | dEnergy(BTU) | 
|
|||||
| 96.7 | 96.1 | -0.6 | -50.4 | ||||||
| 96.5 | 95.7 | -0.8 | -67.2 | ||||||
| 92.3 | 92.7 | 0.4 | 33.6 | ||||||
| 80.3 | 81.8 | 1.5 | 126 | ||||||
| 65 | 68 | 3 | 252 | ||||||
| 86.16 | 86.86 | 0.7 | 294 | ||||||
| 294 | |||||||||
| 54F water add -- 2 gals added at 54F | 
|
||||||||
| PreAdd | PostAdd | dTemp(F) | dEnergy(BTU) | ||||||
| 96 | 95.2 | -0.8 | -67.2 | ||||||
| 95.8 | 94.2 | -1.6 | -134.4 | ||||||
| 92.6 | 92 | -0.6 | -50.4 | ||||||
| 81.8 | 81.8 | 0 | 0 | ||||||
| 67.9 | 67.1 | -0.8 | -67.2 | ||||||
| 86.82 | 86.06 | -0.76 | -319.2 | ||||||
| -319.2 | |||||||||
Gary 4/26/05