
Search
The Renewable Energy site for Do-It-Yourselfers
How Much Collector
Area Do I need to Heat My Home?
|
I get asked this question a lot. Its a good question, but the problem
is that its tough to give a good answer.
The answer depends on many factors -- the main ones being:
- The heat loss from your home -- that is, how well its insulated
and how big it is.
- Your local climate -- both how cold it is and how sunny it is.
- The percentage of solar heating you want to achieve -- the
Solar Fraction.
If you live in a cold climate with not much sun in the winter and have a
large and poorly insulated home, you might have to cover half the county
with collectors to get a high Solar Fraction. On the other hand,
if you live in a in a good sun place (say Denver), and have a modest
size and well insulated home, the collector area needed for a good Solar
Fraction will be far far far less. |
|
I have been giving people some rules of thumb to get a very rough idea how
things might come out in their situation. I've been looking for a tool that will give a better answer and is
not to difficult to use. The new
collector output simulation tool offered
by Andy Schroder looks to me like part of the answer.
Andy's Solar Collector Power Output simulator provides a hour by hour, year
long simulation of the heat output for: the collector you select, in
the location you live, at the tilt angle and azimuth you select, and for the
output temperature that you select. The simulator uses the efficiency
curve of the collector you select along with a local weather file to simulate
collector performance and report daily energy collected.
You can directly use the heat output from Andy's collector to do a rough
estimate of the heating fuel you will save for the collector configuration you
enter.
If you combine Andy's calculator with our Home Heat Loss calculator, you can
get some idea of the fraction of solar heating that a given area
of collectors will provide for your house. That is, you can answer the
question: "How much collector area do I need to heat my home?" -- or at
least take a reasonable cut at it.
In addition to the example below that shows you how to estimate how much
collector area will be needed to reach a certain fraction of solar heating for
your house, I
also did some examples for a few places in the US, all using the same 2000 sqft
pretty well insulated house here... This might give you a quick gut feel
for what solar can achieve (and what it can't).
If you don't want to go through the detailed example just below, you might
summary of what is likely to be the "bottom line" for most
of us...
Overview of the Method
While this is a fairly lengthy procedure to go through, there is really no
math to do -- you just have to look up some values for your area, and plug them
into the short spreadsheet you can download below.
There are three basic steps
1 - Estimating your homes heat loss by month.
2 - Entering your collector area, and some basic information on your
heating system.
3 - Estimating the heat output of your solar collector array.
These results of each of these steps are entered into a simple spreadsheet
that then calculates the fraction of your heat that will come from solar each
month, and the associated dollar saving.
So, download the spreadsheet here...
And, go through the 3 steps just below.
Step1 - Estimating The Monthly Heat Loss
for Your House
The first step is to estimate the
total heat loss for each month of the heating season for your house -- this will
later be compared to the solar gain from your solar collectors to give a solar
fraction.
Your house heat loss depends
primarily on two things:
- How cold it is outside
- How well insulated and sealed
your house is.
Estimating Your Home's "R Value"
We will use the
Home Heat Loss Calculator to make an estimate of how much of a heat leaker your house is.
We will calculate what the HVAC people call the "UA" for the your house -- this
is the heat loss per degree for your entire house. So, if the UA of your
house comes out (say) 300 BTU/hr-F, this means that for every degree of
temperature difference between the inside of your house and the outside, the
house will be losing 300 BTU of heat in one hour. So, if its 70F inside
and 40F outside, and you have UA of 300 BTU/hr-F, then you would be losing about
(70F - 40F)*(300 BTU/hr-F) = 9000 BTU per hour of heat energy.
The UA for your house depends on how
big it is, how well insulated it is, and how well sealed it is. The
calculator will work you through this to get a UA number. So, go to the
Home Heat Loss Calculator, fill in the inputs for your home, and get the "UA"
total for your home. The number you want is the UA "Total", which is the
sum of the losses from walls, ceilings, floors, ...
Getting together the information
needed to calculate the heat loss for your house will take some time and effort,
but its very helpful to know which parts of your home are resulting in the
largest part of the total heat loss, so that you can address these areas with
better insulation or better sealing. There are several examples given on
the Home Heat Loss calculator page that may be helpful.
Once you have the UA total for the
house, enter it in the spread sheet as the "UA House" input.
Look Up the Heating Degree Days For
Your Location
To calculate the monthly heating
requirement for your house, you will also need to know the number of Heating
Degree Days for each month through the heating season for your area. Heating Degree Days are basically a
measure of how cold your climate is -- they are
explained here...
One good place to get your HDD
numbers is the BizEE Degree Days website.
To get your Heating Degree Days from this site, do this:
1- Use the "Station Search" to
find a good weather source near you. Enter your zip code, and
then pick a good weather source. For the example, I'm in zip 59715,
and I use the KBZN airport as my source.
2- Check off "Heating"
3 - Check off "Fahrenheit"
if using US units, or "Centigrade" if using SI units
4 - Use a Base Temperature of 65F
5- In Breakdown, select "Average"
6 - In Period Covered, select "5
years"
7 - Click on the "Generate Degree
Days"
Once the calculation has completed,
click on the "Download Now" button to get your HDDs. Your computer may
offer to open the file with your spreadsheet program -- I'd take this option if
offered. Otherwise, download the file of HDDs, and then open the file
with a text editor such as NotePad.
You should see a list showing the
number of HDD's for each month of the year. There is also a "% estimated"
column, which basically indicates the quality of the data -- it the % Estimated
is high, then you might want to go back and pick another weather source.
Take a look at the numbers, and
decide how many months you want to include in your heating season. I would
eliminate any mid summer months in which you know you would never run the
furnace, but I would keep the spring and fall months in which you do run the
furnace sometimes -- these are typically months is which solar fractions are
highest.
Now enter the HDD's for your heating
season months in the spreadsheet as shown just below. Enter the HDD's in
the column labeled "HDD" (light blue background). For the months you
consider outside your heating season, enter zeros.
Now that you have entered the UA
value and your Heating Degree Day estimates for each month, you should now see reasonably
accurate monthly heat loss numbers for your house in the "Heat Loss" column.
Step 2 -- Heating Plant Inputs
Enter your inputs for the blue cells
in this part of the spreadsheet:
|
UA house |
250 |
BTU/hr-F (the house heat loss per degree F from Home Heat Loss
Calculator |
|
|
|
Collector area |
240 |
sqft |
|
|
|
|
|
|
| |
|
|
|
|
|
|
|
|
|
Fuel Energy/unit |
92000 |
Enter the energy per unit of fuel you use in BTU -- e.g.
Propane = 92,000 BTU/gal, Electricity = 3412
BTU/gal, Nat Gas = 100000 BTU/t |
|
Fuel price/unit |
$2.20 |
Enter the price you pay per unit of fuel -- e.g. we
pay about $2.20 per gallon of propane, and about $0.10 per KWH of
electricity) |
|
Heating Efficency |
0.75 |
Enter the overall efficiency of your propane, gas or electric heating
system |
|
|
- UA House -- enter the UA
for the house if you have not already.
- Collector area -- enter
the total area of the collector
you plan to install in the "Collector Area" cell.
The collector area should include the
area of all the active collectors you plan to install.
I would also include the collector
area the area of any south facing windows that meet these criteria:
- The windows receive sunlight
for a substantial part of the day (eg from 9am to 3pm).
- The glass used in the windows
has a medium to high SHGC (Solar Heat Gain Coefficient).
This approach basically allows the
passive solar gain of the south facing windows to be included in the solar heat
gain. South facing windows with a high to medium SHGC are generally as
efficient (or even more efficient) than dedicated active collectors.
So, as an example, if you plan to use
four 4 by 10 ft collectors (160 sqft), and you have 100 sqft of south facing
windows that meet the criteria listed above, you would enter 260 sqft in the
"Collector Area" cell of the spreadsheet.
- Fuel Energy/unit --
enter the fuel energy per Unit of fuel for the fuel you use.
For propane, this is 92,000
BTU per gallon
For Electricity, this 3412 BTU per KWH
For Natural Gas, this 100,000
BTU per therm
- Fuel price/unit -- enter
the price you pay for each unit of fuel -- e.g. we pay about $2.20 per
gallon of propane
- Heating Efficiency --
enter the efficiency of your heating plant.
This is likely to be lower (worse) than the quoted efficiency for your
furnace due to duct losses etc.
Step 3 - Estimate Collector Heat Output
Using Andy's
Solar
Collector Power Output simulator enter inputs to reflect your situation.
Here is an example for:
- Billings, Montana
- Single glazed, selective
surface flat plate collector (represented by a Heliodyne Gobi 410)
- Using an average collector
inlet temperature of 45C (113F) with a 5C (9F) temperature rise through the
collector.
- Collector aimed due south and
tilted to 70 degrees for good winter performance (note 1)
- Average over 10 days (this
makes it easier to read the monthly averages needed below)
- Check the output per square
meter rather than per collector.
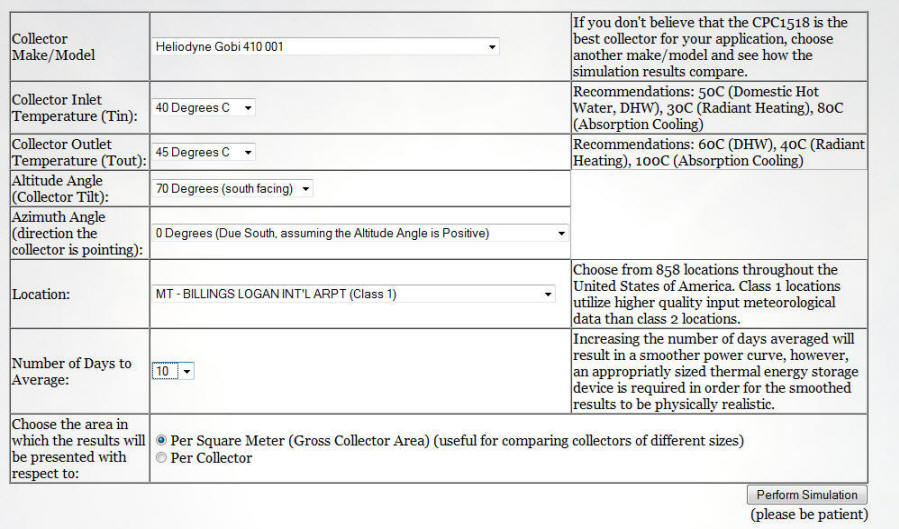
This is the simulation output:
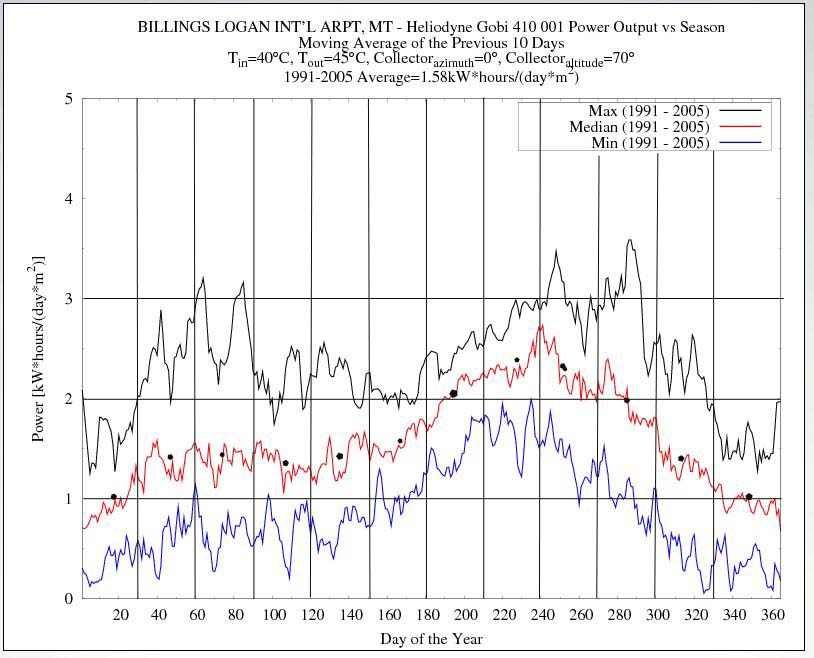
I added end of month vertical lines
to make it easier to read off the average monthly values.
As an example of how to read the
chart, the chart tells you that for day 180
into the year, the heat output from 1 sq meter (10.8 sqft) of collector varies
from a low of about 1.25 KWH for the day to a high of about 2.35 KWH for the
day, with a median output of about 1.75 KWH for the day. So, if you had (say) 10 square meters of
collector, then you have a 50% probability of seeing about 18 KWH a day of heat output to
the storage tank.
Now eyeball estimate the average
daily output for each month of the year. The small black dots indicate my
guesses at average daily output for each month -- eg just over 1.0 for January.
Enter the average monthly values in
the spreadsheet column labeled "Andy Output". For months that you
consider to be fully outside of the heating season (as discussed above), enter
zero.
| |
Note that if you are used to working with spreadsheets, you can
download Andy's simulation output as a CSV file that your spreadsheet
software can read. You can then add an equation for each month
that calculates the average daily output for that month.
But, this is not at all critical -- the eyeball estimates will work fine
for this kind of rough estimate. |
These average daily outputs will be
used to estimate the output for each month and to compare that to your home heat
loss for the same month giving you the fraction of heat that comes from solar.
This completes the inputs, and the
spreadsheet should now look like the one just below, but with your inputs and
outputs.
|
How Much Collector Area Do I Need To Heat My House? |
|
|
|
| |
|
|
|
|
|
|
|
|
Enter inputs for your house and collector in the blue cells |
|
|
|
| |
|
|
|
|
|
|
|
| |
|
|
|
|
|
|
|
|
UA house |
250 |
BTU/hr-F (the house heat loss per degree F from Home Heat Loss
Calculator |
|
|
Collector area |
240 |
sqft |
|
|
|
|
|
| |
|
|
|
|
|
|
|
|
Fuel Energy/unit |
92000 |
Enter the energy per unit of fuel you use in BTU -- e.g.
Propane = 92,000 BTU/gal, Electricity = 3412
BTU/gal, Nat Gas = 100000 BTU/Therm) |
|
Fuel price/unit |
$2.20 |
Enter the price you pay per unit of fuel -- e.g. we
pay about $2.20 per gallon of propane, and about $0.10 per KWH of
electricity) |
|
Heating Efficency |
0.75 |
Enter the overall efficiency of your propane, gas or electric heating
system |
|
| |
|
|
|
|
|
|
|
| |
HDD |
Heat Used |
Andy Output(1) |
Solar Heat Out |
Usable Solar Heat |
Solar Fraction |
Fuel Saving |
| |
(F-day) |
(BTU/mo) |
(KWH/sqm-day) |
(BTU/mo) |
(BTU/mo) |
|
(dollars) |
|
Jan |
1303 |
7,818,000 |
1.3 |
3,017,527 |
3,017,527 |
0.39 |
$96.21 |
|
Feb |
1027 |
6,162,000 |
1.6 |
3,713,880 |
3,713,880 |
0.60 |
$118.41 |
|
Mar |
924 |
5,544,000 |
1.7 |
3,945,997 |
3,945,997 |
0.71 |
$125.81 |
|
Apr |
666 |
3,996,000 |
1.6 |
3,713,880 |
3,713,880 |
0.93 |
$118.41 |
|
May |
0 |
0 |
0 |
0 |
0 |
0.00 |
$0.00 |
|
Jun |
0 |
0 |
0 |
0 |
0 |
0.00 |
$0.00 |
|
Jul |
0 |
0 |
0 |
0 |
0 |
0.00 |
$0.00 |
|
Aug |
0 |
0 |
0 |
0 |
0 |
0.00 |
$0.00 |
|
Sep |
0 |
0 |
0 |
0 |
0 |
0.00 |
$0.00 |
|
Oct |
653 |
3,918,000 |
2.2 |
5,106,584 |
3,918,000 |
1.00 |
$124.92 |
|
Nov |
967 |
5,802,000 |
1.2 |
2,785,410 |
2,785,410 |
0.48 |
$88.81 |
|
Dec |
1422 |
8,532,000 |
1 |
2,321,175 |
2,321,175 |
0.27 |
$74.01 |
|
Year Total |
6962 |
41,772,000 |
|
24,604,452 |
|
0.59 |
$746.59 |
| |
|
|
|
|
|
|
|
|
Notes: |
|
|
|
|
|
|
|
|
(1) The monthly heat output from the collector as calculated by Andy's
Collector Power Output simulation |
|
So, now you have for each month and
for the full year:
- The heat you use each month
- The heat that your solar
heating system provides for each month
- The fraction of your heating
that solar supplies
- Your estimated dollar saving in fuel.
You now you have a rough idea how
much of your heating demand this solar collector array will meet.
From here, you can start playing around with different strategies for improving
things -- would you be better off adding more collector area, or more attic
insulation, or better windows, etc. This is the real value of this
exercise -- it gives you a basis for making intelligent decisions about where to
spend your energy saving dollar.
The "Bottom Line" Message For Most of Us
One other thing I should mention that might be appealing to people who don't
want to go through all this stuff. For the situation in which 1) you are
retrofitting solar to an existing house with typical to pretty good insulation,
and 2) you live in a cold to moderately cold climate. Then, the answer as
to how much collector you should have is almost always: "Add as much
collector area as you have space for and budget for." That is, with typical
house insulation and infiltration levels in coldish climates its almost impossible to add so much
collector area that you will go over your heating needs. Homes with VERY
good insulation, or homes in more moderate climates, or homes in very sunny
areas, or homes owned by people with big collector budgets may be a different
story, but for most of us, the "add as much collector as you can" ground rule
works pretty well.
Notes:
- There are many approximations and sources of error in this method -- some
of the most obvious ones:
- The simulation uses a fixed temperature for the collector, when in fact
the collector temperature varies throughout the day -- other approximations in the simulation are
covered on Andy's website.
- The Home Heat Loss Calculator has a whole raft of approximations which
are explained on the calculator page.
- The simulation does not include any of the interaction between the heat
storage system and the collectors -- it basically assumes that if the
collectors can provide the heat, you will have a way to store it and use it
later.
- The losses from the system components outside the collectors (primarily
storage) are not included. These should be fairly small on a well
insulated system, but can be large if the system is not carefully designed.
- The simulation (I believe) does not fully account for the beneficial effects of reflected
light off a snow field on steeply tilted or vertical collectors -- this can
be a significant bonus, and the nice thing is that it adds to collection
without increasing heat loss (as increasing collector area would).
- Nothing in the method accounts for passive solar gains from south
facing windows. If you have windows with a good SHGC and have some
means to insulate them from night heat loss, these windows can be very
effective collectors. You should include them in your collector area
as discussed above.
Still, I think this method is a world better than the rules of thumb I used
to use, and should give a fairly good idea how a well designed system should
perform.
- I should say that Andy represents and sells a particular brand of solar
collector (a very interesting design). But, the simulation offers a wide variety of collectors, and,
as far as I can tell, Andy treats them all fairly.
My thanks to Andy for providing this very helpful tool.
Comments, suggestions, corrections (as always) are most welcome ...
Gary April 14, 2010