
Search
The Renewable Energy site for Do-It-Yourselfers
When I first tested the screen absorber collector side by side with the pop-can absorber collector, it was in the summer and the ambient temperature was around 80F. This is clearly not ideal for testing collectors that are intended for winter space heating, but I decided to pass the info on anyway and then repeat the test in the winter.
So, this page is the initial summer test saved for anyone who is interested in seeing how the collectors compare in warmer weather. The main pop-can vs screen collector page is here along with the winter side by side test.
Side by Side Testing
Test Setup
The two collectors (each 2 ft wide by 3 ft high) were mounted on a stand that holds them at the same orientation to the sun.
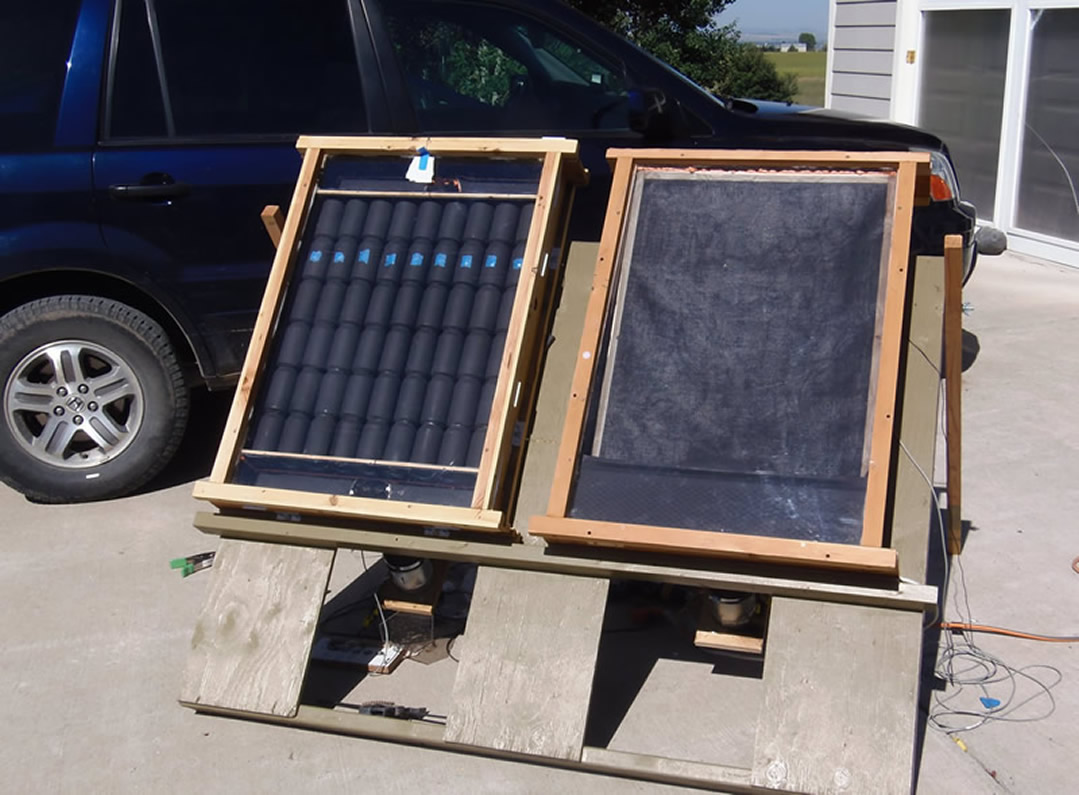
Each inlet duct was connected to its own small blower. The blowers are duct booster fans sold at Home Depot. They are not very good fans when there is any significant pressure drop, but the fact that both the pop can and screen collectors both have low air resistance and only 6 sqft of area made them just about right for this job.
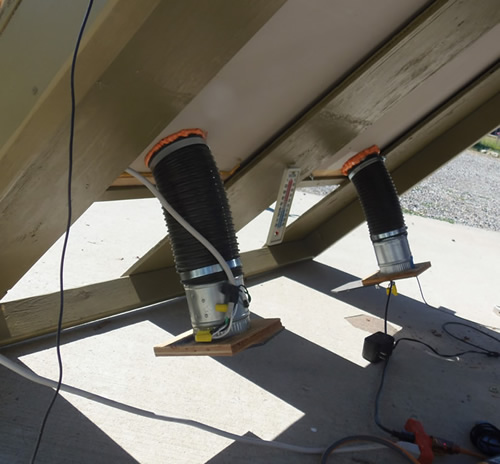
The two identical inlet blowers.
|
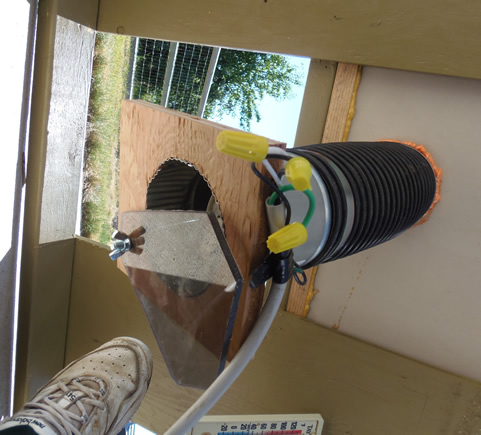
The shutter that is used to adjust both collectors to the same
air flow rate.
|
The back of the collector stand showing the inlets and blowers for each collector. The inlet to each blower has a shutter that allows airflow to be adjusted to provide the same airflow on each collector.
The collector outlets each have about 2 ft of 4 inch duct attached to them to allow the airflow to settle down and become more uniform. Airflow is measured at the end of the duct with a calibrated Kestrel turbine style anemometer.
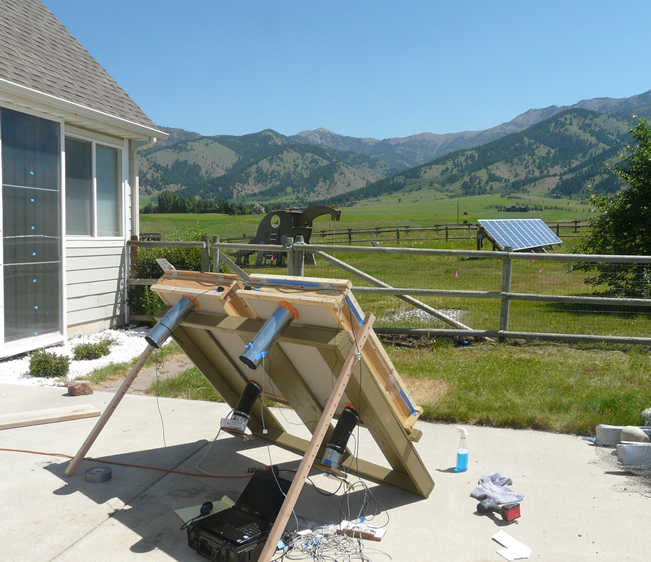
The two 4 inch outlet ducts at the top, and the
two 4 inch inlet ducts at the bottom.
|
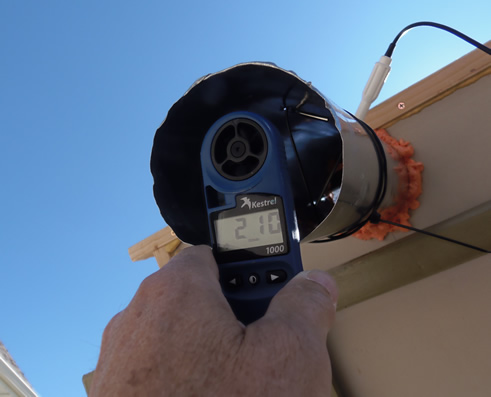
Kestrel anemometer measuring outlet flow.
|
For this test, the outlet temperatures were measure with Hanna Checktemp thermometers. These thermometers come with a calibration certificate, have an accuracy of 0.3C, and have built in calibration check. Inlet temperature was the same for both collectors and was measured by a Taylor alcohol thermometer placed between the two collectors at inlet level.
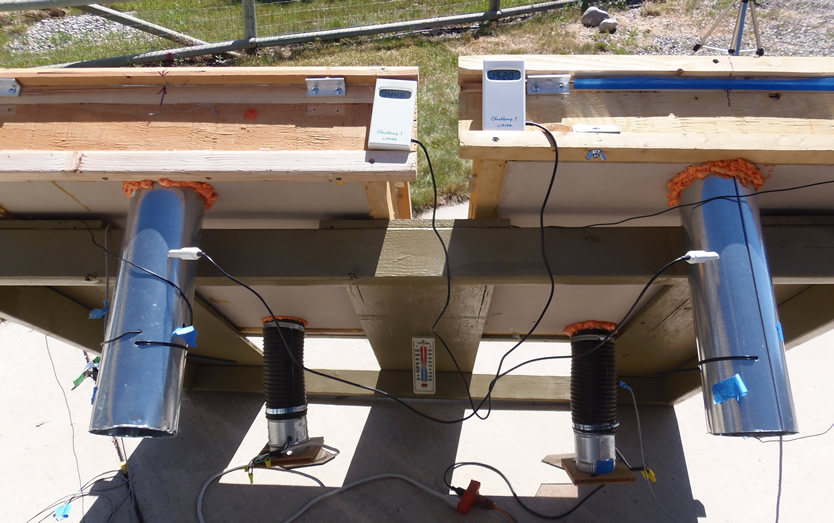
The Hanna thermometers are next to each other at the top, and their stainless steel probes are the
white handles sticking into the outlet ducts about 6 inches from the collectors.
|
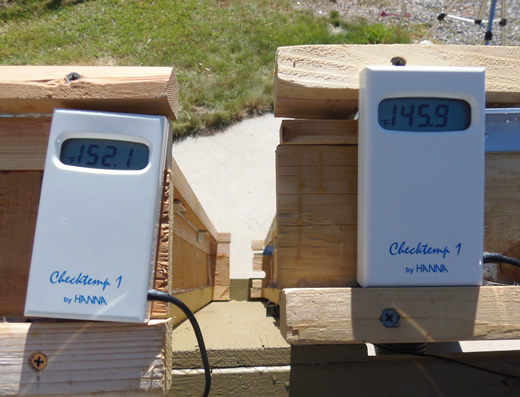
The two Hanna thermometers.
|
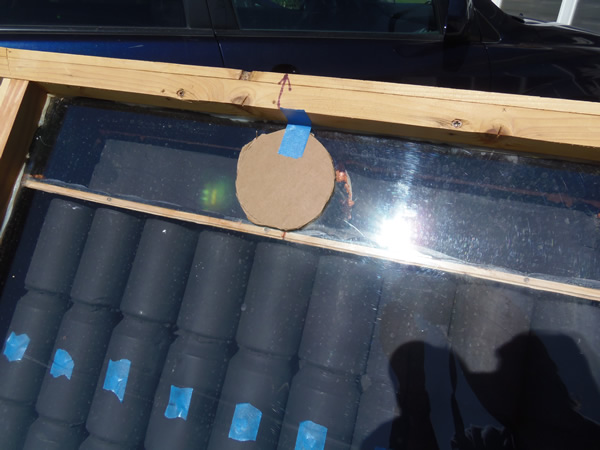
Cardboard shading disks were put on top of the glazing to shade the outlet ducts
from direct sun and avoid direct sun on her temperature probes.
Side by Side Test Results
I did a tests on a couple days with very similar results -- the results below are for the 2nd day (7/21/13).
Both were very sunny days with no visible clouds or haze, and light to no wind.
The ambient temperature was mid 80'sF at the time of the test. Not ideal for testing a space heating collector, and I will repeat the test when we get some cold weather.
For the test, the outlet duct flow velocity for both collectors was adjusted to 235 ft per min. This is the velocity of the pop can collector with the flow adjustment shutter all the way open. The screen collector has a bit less flow resistance and the shutter was closed part way (as shown in the picture above) to cut its velocity down to 235 fpm. The area of the 4 inch duct is 0.0872 sqft, and the resulting flow rate is (235ft/min)(0.0872 ft^2) = 20.5 cfm, or 3.4 cfm per sqft.
For the 7/21/13 test:
| Time |
Pop Can Collector |
Screen Collector |
| |
Tin(F) |
Tout(F) |
Trise(F) |
Flow(cfm) |
Heat
out(BTU/h) |
Tin(F) |
Tout(F) |
Trise(F) |
Flow(cfm) |
Heat
out(BTU/h) |
| 10:40 AM |
85 |
146.3 |
61.3 |
20.5 |
1104 |
85 |
152.1 |
67.1 |
20.5 |
1208 |
| 10:58 AM |
86 |
149.6 |
63.6 |
20.5 |
1145 |
86 |
153.0 |
67.0 |
20.5 |
1206 |
| |
|
|
|
|
|
|
|
|
|
|
The Heat Out column is computed as:
Heat Out = (Trise)(Flow)(Density)(Specific Heat)
For example: At 1:40 AM Heat Out = (61.3F)(20.5 cf/min)(60min/hr)(0.061 lb/cf)(0.24 BTU/lb-F) = 1104 BTU/hr (or 184 BTU/hr per sqft of collector).
The air density is low due to our 5000 ft elevation (sea level standard air density is 0.075 lb/cf).
So, for this test the heat output from the screen collector was about 6% higher than for the pop can collector. This may change for more typical winter heating conditions.
At one point I noticed a slight filmey coating had appeared on the inside of the pop can collector glazing. I took the glazing off and cleaned the film off, reinstalled. After a few minutes, the temperatures settled back in to where they had been, so the film was not opaque enough to make any difference. Not sure what caused the film -- perhaps outgassing from the paint.
At one point I reversed the two thermometers just as a check on their calibration. After a couple minutes, they settled down to very close to the old readings.
IR pictures:
The IR (thermal) image was taken at 11:00 am. It shows the temperature of the glazing on each collector. This is important because most of the collector heat loss is through the glazing, and cooler glazing is an indication of more efficient operation.
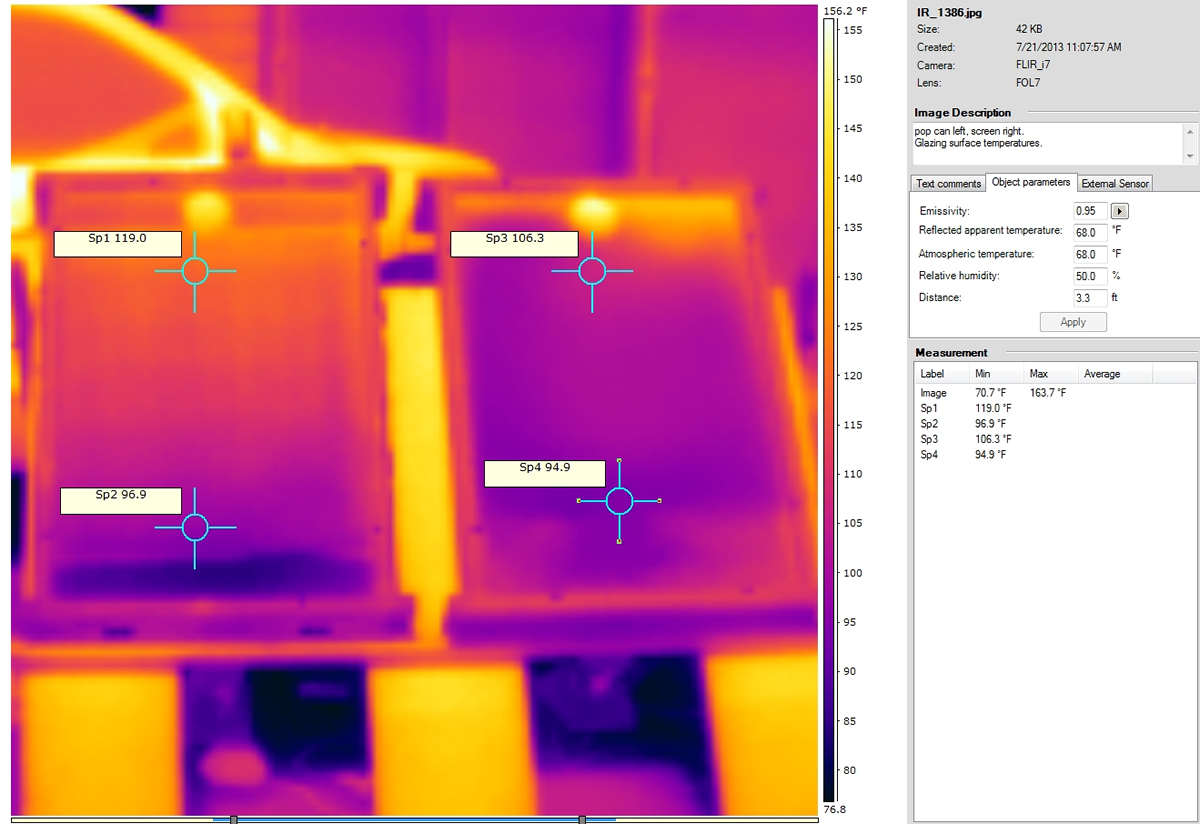
Thermal image of the two collectors: pop can on left and screen on right.
The screen collector shows a lower average glazing temperature, which does tend to agree with it higher heat output. The screen collector glazing temperature is fairly even, which might indicate that the picture of the inlet air spreading over the full surface of the screen and then flowing through it might be true. The pop can collector glazing shows a smooth increase in temperature from top to bottom with no apparent hot spots that might indicate uneven flow through the can columns.
This IR picture shows the pop can collector with the glazing removed:
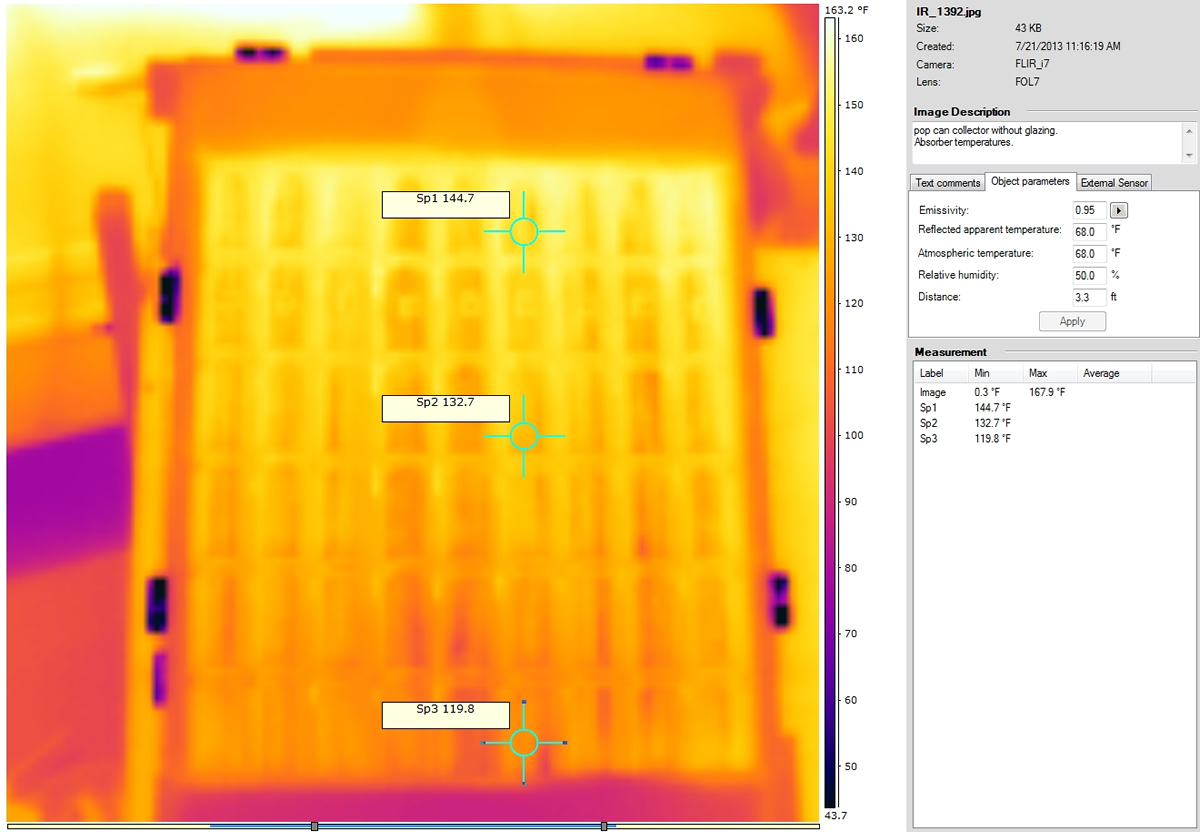
This is showing the actual temperature of the surface of the pop can absorber. It is nice and even with no apparent hot spots that would indicate uneven airflow.
The absorber temperatures seem (to me) to be on the high side given that the inlet air temperature was about 85F. For example, on a good water heating collector, the absorber temperature near would only be about 10F over the water temperature. This might indicate that steps to improve the heat transfer from the cans to the air would payoff?
Anyone glean any other conclusions out of these pictures?


