Search
The Renewable Energy site for Do-It-Yourselfers
Thermal Performance Test -- Low
Thermal Mass Sunspace for Space Heating -- Day 2
|
This page describes a 2nd day of test of a low
thermal mass sunspace that
is optimized for providing space heating to the home its attached to.
The test covers heat gain, efficiency, thermal images, and a
characterization of the living environment inside the sunspace while its
providing space heating to the house.
On this day, the sunspace started with the same vertical heat absorbing
curtain as day 1, but this was taken
down about noon, so that the curtain vs no curtain could be compared.
Bottom line is that the sunspace provides as much heat to the house as a
good active solar collector of the same size would, while also providing
an area that can be used for lounging, clothes drying, and many other
uses.
The additional finding on this test is that adding the vertical curtain
in the middle of the sunspace does not appear to significantly change
performance.
Back to the sunspace main page...
|
|
Page Index
Sunspace Configuration -- January 5, 2013 Test
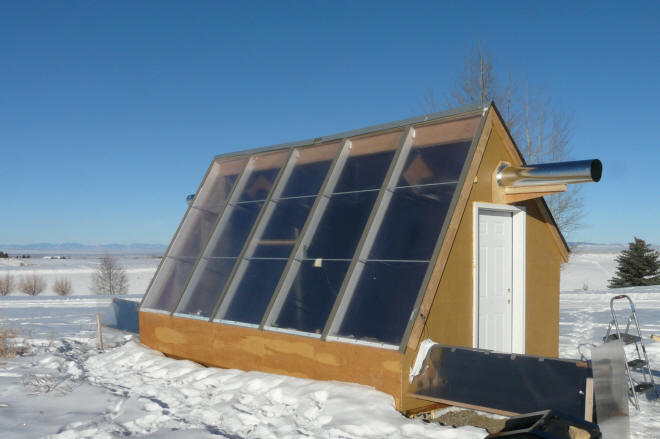
In this test, the sunspace has been optimized for space heating the attached
house via the in the following ways.
Its the same basic configuration as day 1.
- Large area of high tilt angle south facing glazing (200 sf)
- Double glazing in the form of twinwall polycarbonate (to reduce glazing
heat loss)
- Very low thermal mass in the sunspace (so heat goes to the house instead
of heating up sunspace mass)
- Non-glazed surfaces are well insulated and well sealed to reduce heat
loss to the outside (to reduce sunspace heat loss)
- The floor is insulated and low in mass
- All surfaces that see the sun are painted dark to absorb sunlight, and
are low mass (to heat quickly and transfer that heat to the air).
- Two fans to
remove heated air from the sunspace peak -- these fans are pretty well
matched to the maximum rate at which the sunspace can produce heat with one
fan near the east end one near the west end.
More details on the construction, objectives,...
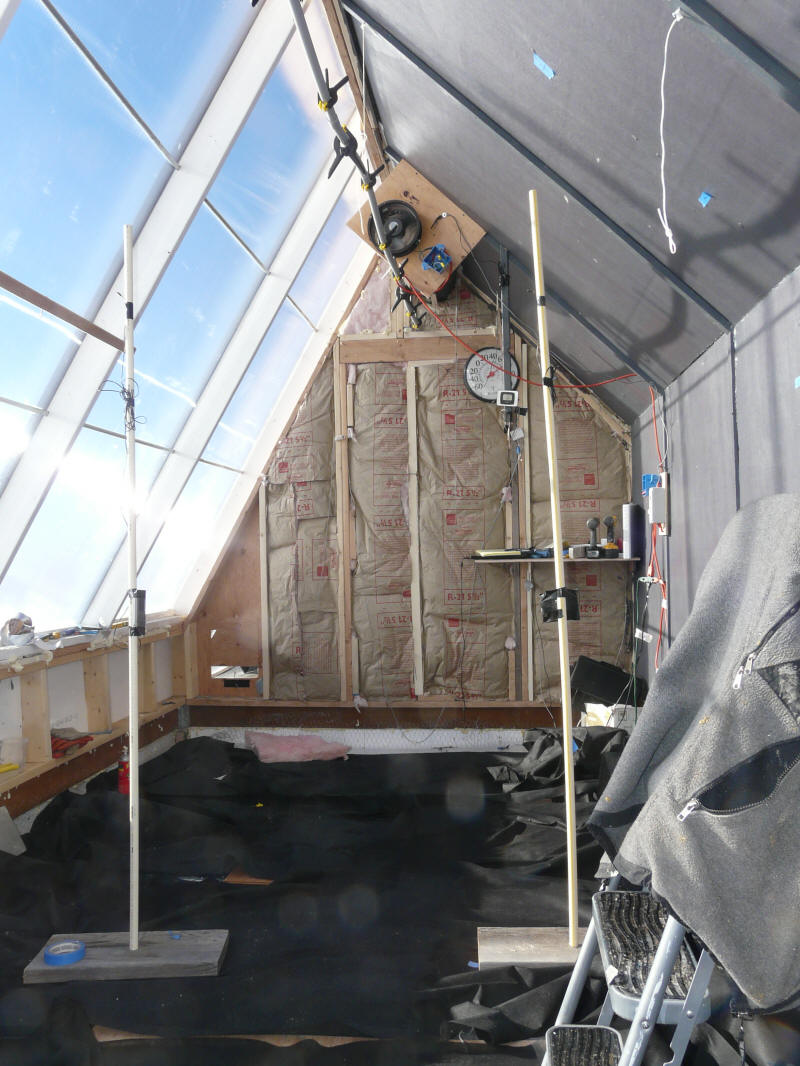
This test starts with the same vertical black weed fabric suspended vertically
down from a support pipe that runs about 2.5 ft below the ridge line.
At about noon, the vertical curtain is removed to see if it results in any
change in heat output.
Vertical Screen
Test starts with the same vertical screen as the
day 1 screen.
A vertical screen was added that starts about 36 inches directly below the peak
and hangs vertically right below the ridgeline. It extends the full
east-west dimension of the space. When the screen hits the floor, it is
carried southward on the floor to the south wall. The screen is Scotts
black weed fabric from Home Depot.
The idea of the screen was to provide surface where solar radiation could be
absorbed and converted to heat. The screen is located directly under the
peak, so heated air can rise directly up both the front and back surfaces of the
screen directly to the collection area at the peak.
The radiation that gets through the screen encounters the back (north) wall and
is absorbed there. Air heated by the back wall and roof rise up the wall
and roof slope into the collection area in the peak.

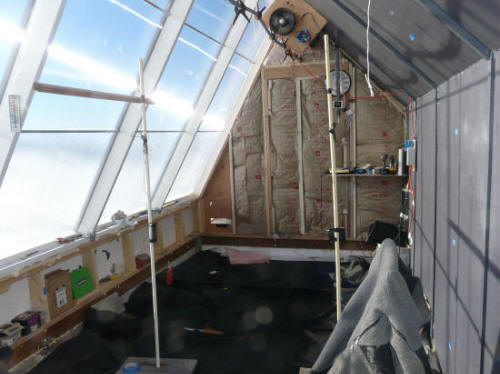
At about noon, the vertical screen is dropped and just laid out on the floor as
in this picture.
So, the solar radiation that was absorbed by the screen now hits the north wall
and floor and is absorbed the dark paint.
Inlets and Outlets
Same as fro day 1 inlets and outlets
Heating Performance
This was another very clear day. Its also only a couple weeks after the
Winter Solstice, so the days are short and the sun is low in the sky (about 23
degrees at noon). The outside air temperature was in the 20'sF. Wind
was generally light.
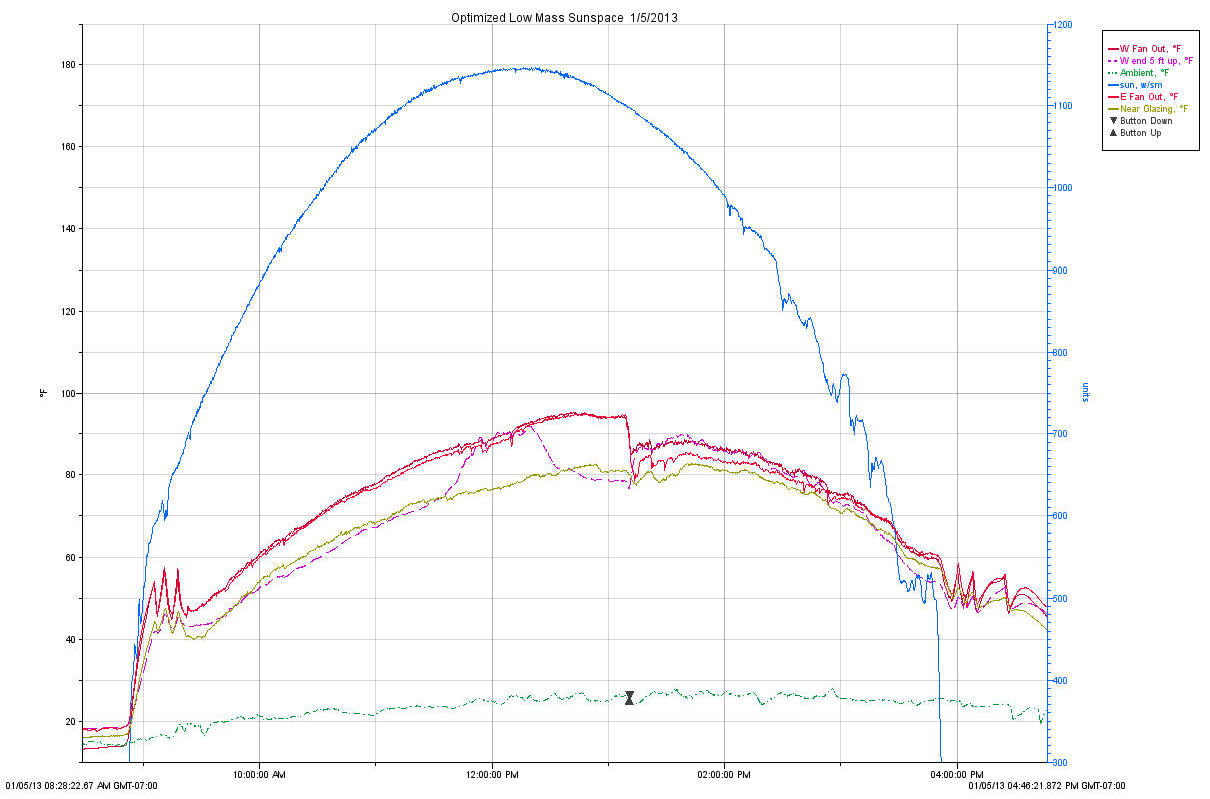
Blue solid line -- sun intensity (w/sm)
Red Lines -- Fan outlet temperatures for East and West fans (F) -- this is
the temperature of the heated air going to the house for space heating.
Green dash-dot -- Ambient temperature (F)
Purple dash line - Temperature at about the 5 ft level in the sunspace (F)
Yellow-Green solid line - Temperature 1 inch from glazing in shade (F)
The sunspace was run in the same configuration as day 1 until 1:10 pm, at which
time the vertical curtain was dropped to the floor. The black curtain was
spread out on the floor so that it covered the whole floor. The floor
surface without the screen would have been the reflective film on the 1.5 inch
Styrofoam that was on the floor.
Total flow rate for the outlet ducts was 670 cfm (based on 614 fpm at outlet
ducts). Same as day 1.
Start Up
Right at the start of the day (8:55 am), the sun comes on the sunspace, and all
of the air temperatures rise very rapidly. After about 10 minutes (9:05
am), it gets hot enough for the controller to turn on the fans, which stops the
rapid rise in temperature by exporting the heated air outside. It gives an
idea how fast the temperatures rise when the sun hits the sunspace, and how
effective the fan system is in controlling the temperatures and exporting what
would otherwise be excessive heat.
The three peaks in the fan outlet temperature (red at 9:10 to 9:20 am) is the
fan short cycling. There is also some fan short cycling at the other end
of the day around 4 pm.
There is a strange bump in the temperature sensor mounted at 5 ft about the
floor north of the screen for half an hour at noon. This also appears on
the day 1 plot. Not sure, but I think that during the time period, the
sensor is getting direct sun from a gap between the two fabric panels in front
of it.
Dropping the Curtain
At 1:10 pm, the vertical curtain is dropped to the floor (marked by twin
triangles on the plot).
There is a rapid temperature drop of about 10F in the fan outlet temperature,
followed by a gradual rise. During the period, the sun intensity is
steadily dropping.
At first glance, it looks like dropping the curtain does result in a significant
drop in temperature and heat out, but looking more carefully, I don't think so.
The rapid initial drop may be due to the curtain dropping process and transients
caused by that. If you go a few more minutes down the plot, it looks like
the fan outlet temperature curves just about regain the temperature they would
have had (with the dropping sun levels) if the curtain had been left up.
I'm inclined to think that the efficiency difference between the two is small if
any.
A couple things that do definitely change:
-
The east and west fans which were operating at nearly identical outlet
temperatures develop a difference about 5F, with the west fan having the
higher temperature. Don't know why this happens -- somehow the curtain
was resulting in a more consistent temperature along the ridge.
-
The temperature sensor that was located 5 ft above the floor and half way
between the curtain and the north wall, and about 4 ft east of the west wall
(purple dash line), jumps up in temperature to about the same as the fan
outlet temperature. This goes on for the rest of the test. One
difference is that this sensor would be in the sun with the curtain down --
this may account for the difference.
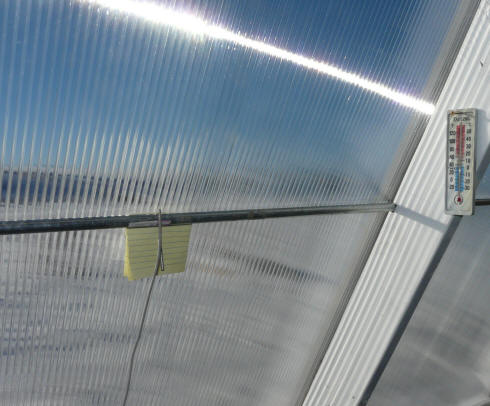
Temperature logger about 1 inch from the glazing. It is shaded by the
yellow paper.
So, in the end, it does not seem to make much difference in performance if the
curtain is up or down. It does make a difference in the comfort level.
I think its nice to be able to have some form of movable curtain, probably
closer to the glazing, that can be deployed to create a more shaded spot during
the brightest part of the day, and then slid over to the side at other times.
It looks like you can do this with little to no performance drop.
Cool Down at Sunset
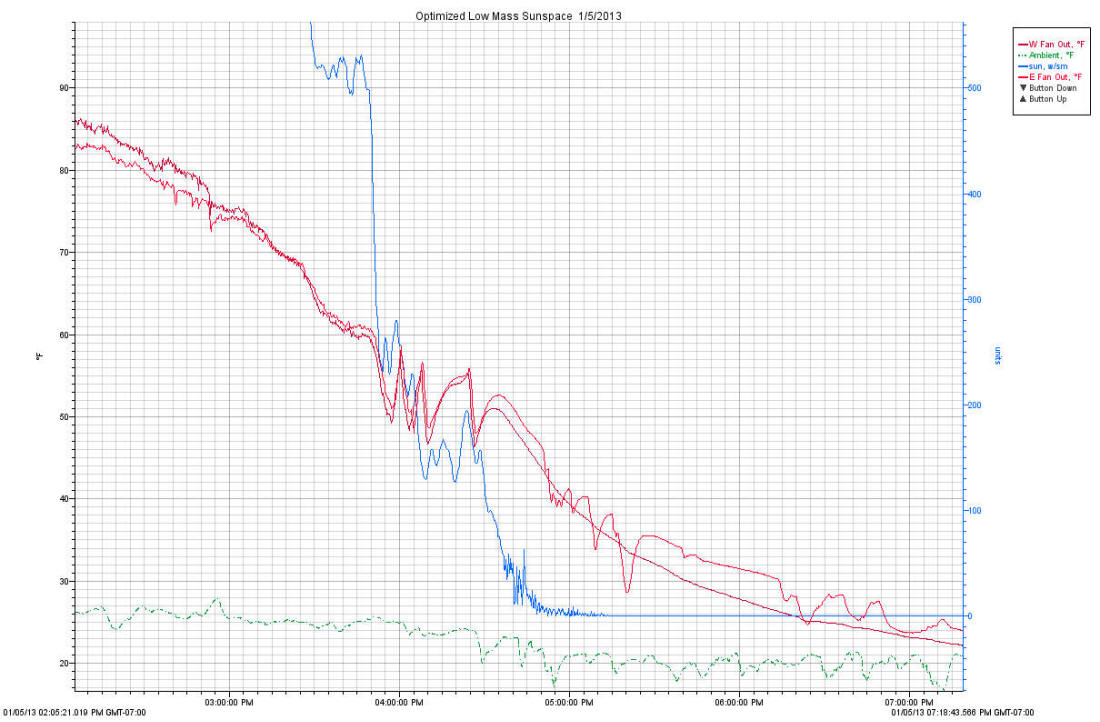
This is a zoom in on the full day plot above to the time near sunset.
At about 4pm, the sun intensity is down enough so that the fans start to short
cycle.
From the time the sun intensity drop to less than 100 w/sm until the sunspace is
within a couple degrees of outdoor ambient is about 2 hours. So, with the
low thermal mass, it warms up fast and it cools off fast.
Heat Production and Efficiency
Heat production and efficiency were similar to the
day 1 test
Temperature Environment in Sunspace
The thermal images of the inside of the sunspace were very similar to the
day 1 test
Air and Surface Temperatures
The two temperature surveys before are with and without the vertical curtain in
place.
11:47 am with curtain up
Temperatures at 11:47 am -- vertical curtain in place.
Temperatures at 1:33 pm -- no vertical curtain.
In these pictures, the grey filled circles are surface temperatures (taken with
an IR temperature gun), and the teal filled circles are air temperatures taken
with a couple indoor/outdoor thermometers.
As expected, the back wall and the lower north roof temperatures went up because
they now have the sun directly on them.
The air temperatures on the 1:33 pm survey are a bit high for comfort indicating
that somewhat more fan capacity might be good to remove the heat a bit faster,
or there may be other ways to encourage the heated air to get to the peak area
without overheating the lower area? As a practical matter, it did not seem
that uncomfortable, and all of these sensors were in the sun and probably should
have been shaded to get true air temperatures.
Comments
Got comments, Questions, Suggestions -- go
here...
Gary
January 11, 2013