Search
The Renewable Energy site for Do-It-Yourselfers
Thermal Performance Test -- Low
Thermal Mass Sunspace for Space Heating -- Day 1
|
This page describes a sunny day test of a low thermal
mass sunspace that is optimized for providing space heating to the
home its attached to.
The test covers heat gain, efficiency, thermal images, and a
characterization of the living environment inside the sunspace while its
providing space heating to the house.
Bottom line is that the sunspace provides as much heat to the house
as a good active solar collector of the same size would, while also
providing an area that can be used for lounging, clothes drying, and
many other uses.
Back to the sunspace main page... |
|
Page Index
Sunspace Configuration -- January 4, 2013 Test
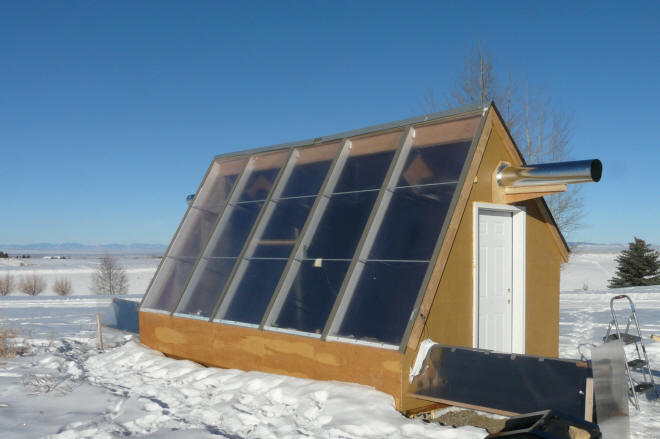
In this test, the sunspace has been optimized for space heating the attached
house via the in the following ways:
- Large area of high tilt angle south facing glazing (200 sf)
- Double glazing in the form of twinwall polycarbonate (to reduce glazing
heat loss)
- Very low thermal mass in the sunspace (so heat goes to the house instead
of heating up sunspace mass)
- Non-glazed surfaces are well insulated and well sealed to reduce heat
loss to the outside (to reduce sunspace heat loss)
- The floor is insulated and low in mass
- All surfaces that see the sun are painted dark to absorb sunlight, and
are low mass (to heat quickly and transfer that heat to the air).
- Two
fans to remove heated air from the sunspace peak -- these fans are
pretty well matched to the maximum rate at which the sunspace can produce heat with one
fan near the east end one near the west end.
This is a mean, lean, heat making machine!
More details on the construction,
objectives,...
In this test, black weed fabric is suspended vertically down from a support
pipe that runs about 2.5 ft below the ridge line. The idea is to see if having this vertical absorbing fabric will get the hot
air up to the ceiling more efficiently. The
day two test eliminates this
curtain midway through the test, to compare performance
with and without the curtain.
I'll just mention again, that this was all done as a quick thermal performance
prototype and looks ugly, but you can make yours look as nice as you like.
You can also make very minimal versions that can be built for $50 ish that still
are very good heaters.
Vertical Screen
A vertical screen was added that starts about 36 inches directly below the peak
and hangs vertically right below the ridgeline. It extends the full
east-west dimension of the space. When the screen hits the floor, it is
carried southward on the floor to the south wall. The screen is Scotts black weed
fabric from Home Depot.
The idea of the screen was to provide surface where solar radiation could be
absorbed and converted to heat. The screen is located directly under the
peak, so heated air can rise directly up both the front and back surfaces of the
screen directly to the collection area at the peak.
The radiation that gets through the screen encounters the back (north) wall and
is absorbed there. Air heated by the back wall and roof rise up the wall
and roof slope into the collection area in the peak.

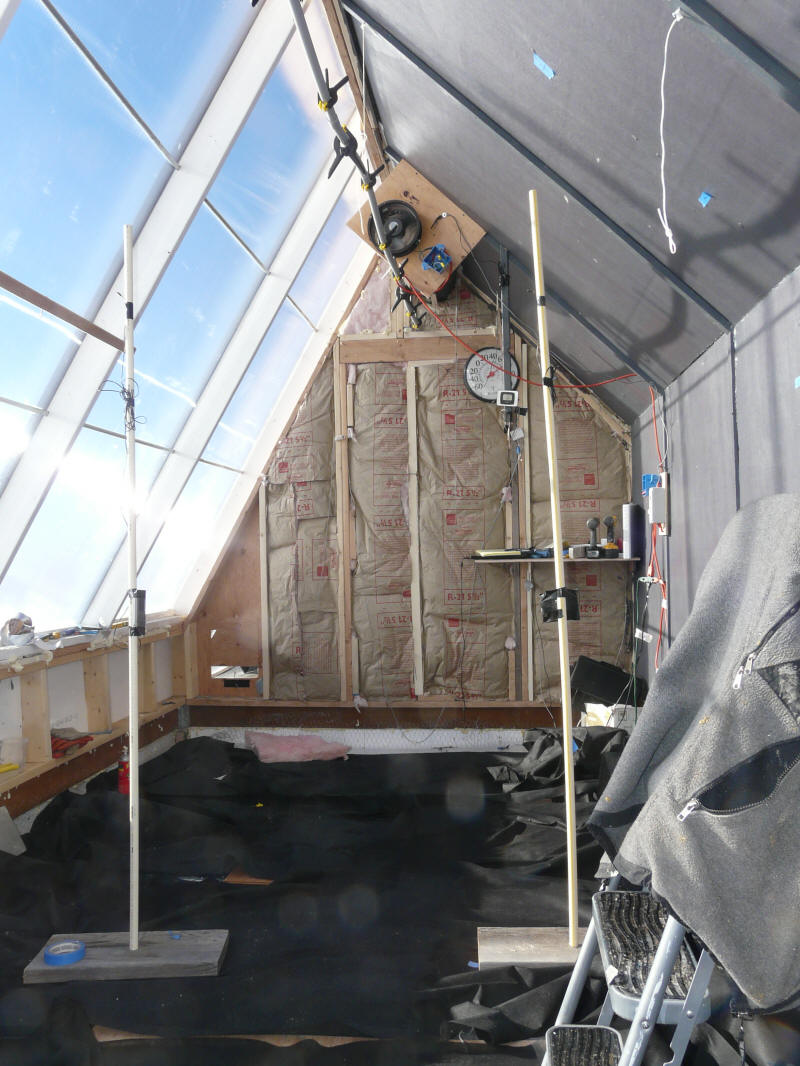
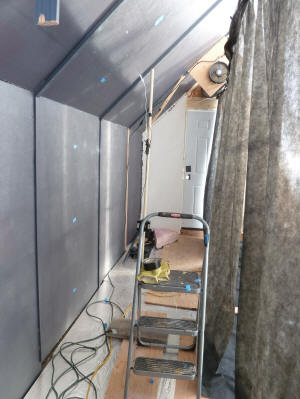
Looking without the vertical weed fabric
in place. The vertical curtain will hang
from the plastic pipe running below the ridge.
The floor is dirt covered with 1.5 inch
Styrofoam insulation with some plywood
walking strips laid on it, and black weed
fabric on top.
The two PVC pipe posts support temperature
sensors. |
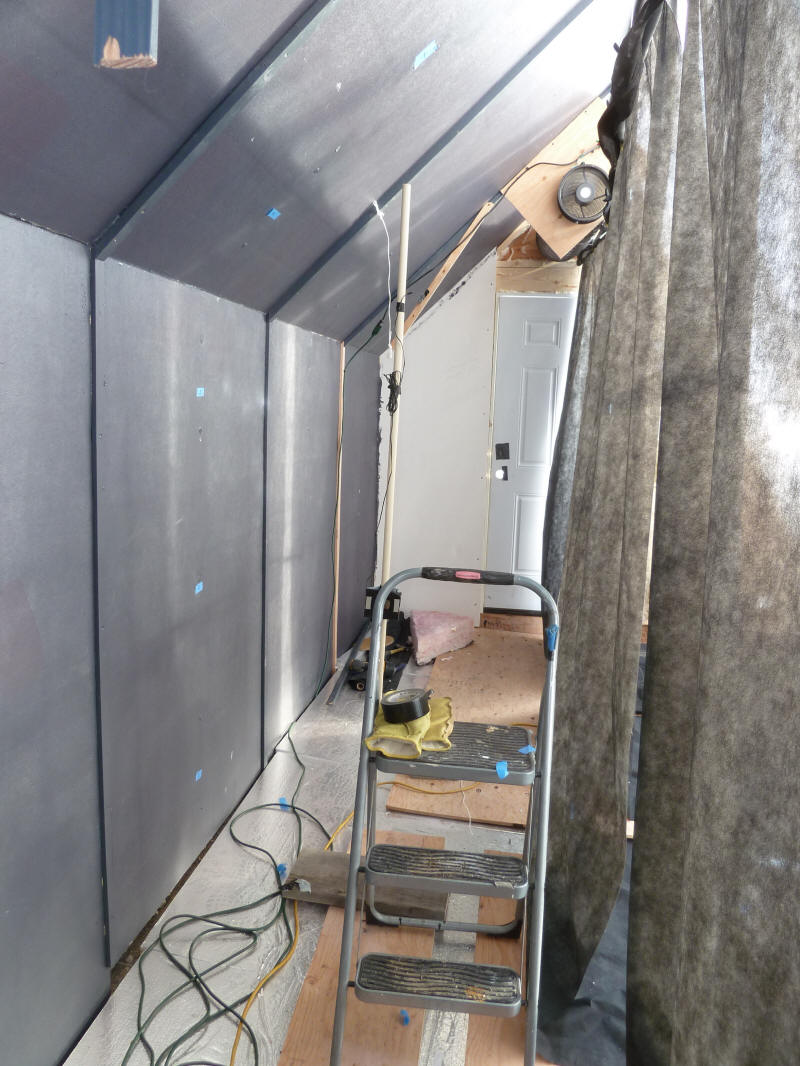
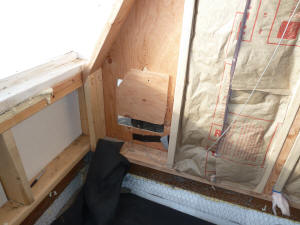
North wall is to left, weed fabric hung from
ridge line to right. The vertical pipe has
temperature sensors at 3 ft and 6 ft off floor
between fabric and north wall.
The blue tape spots mark places where surface
temps were taken. |

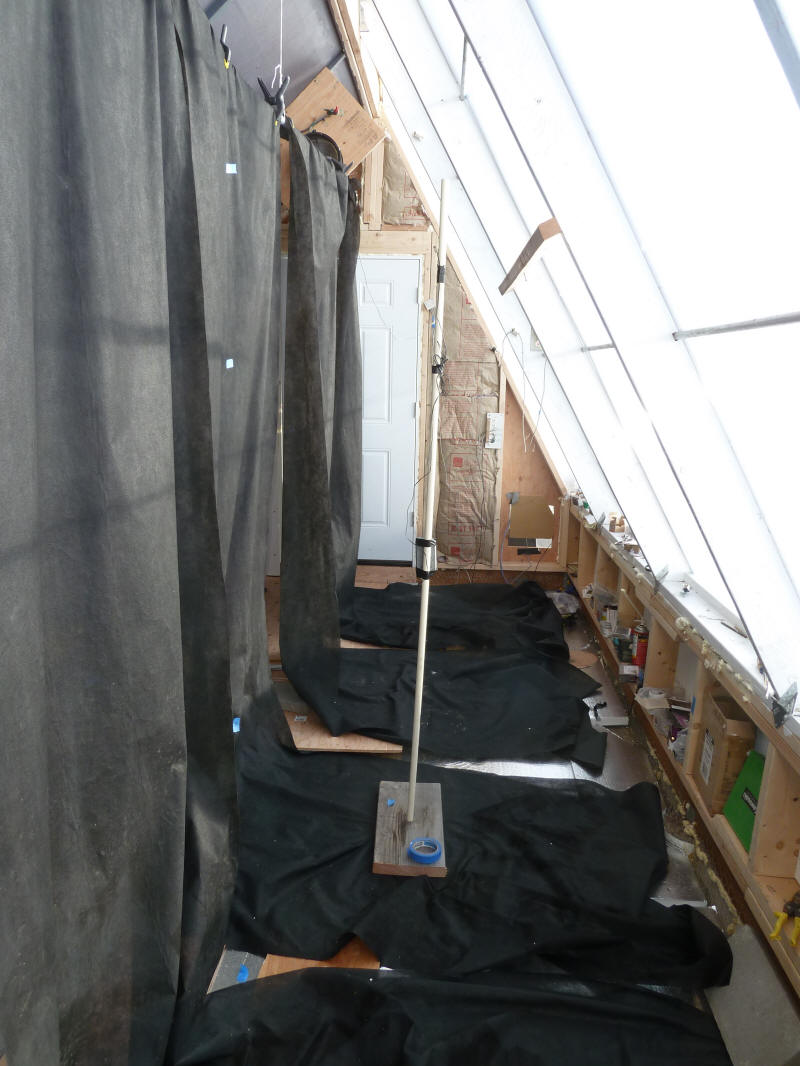
Same configuration with vertical weed fabric
and picture taken on south side of the fabric.
The vertical PVC pipe has two temperature sensors.
The blue tape spots mark places where surface
temps were taken. |
The placement of the screen could be altered to allow more flexibility in the
use of the space. The opacity of the screen might be chosen to provide a
full sun area in front of the screen and a filtered sun area behind the screen.
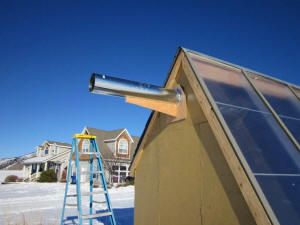
Inlets and Outlets
The inlets for the sunspace are located on the east and west walls down low
and just behind the south glazing. In an attempt to pre-warm the air coming
into the inlet vents, a solar preheat tunnel was added to each inlet (see
picture) . while the inlets were cut as 1 ft square holes in the
wall, they have been reduced to about 3 inches tall by 12 inches wide to prevent
excessive flow and velocity through the inlets -- especially during windy times.
It was my intent to measure the temperature of the pre-warmed air coming in
the inlets and use that for the heating calculation. Due to the details of
the inlet warmers, it was hard to get a good measurement of the actual average
temperature of the pre-warmed air, so I went to using the ambient air
temperature in the heating calculator and just included the area of the pre-warm
glazing in the sunspace glazing area.
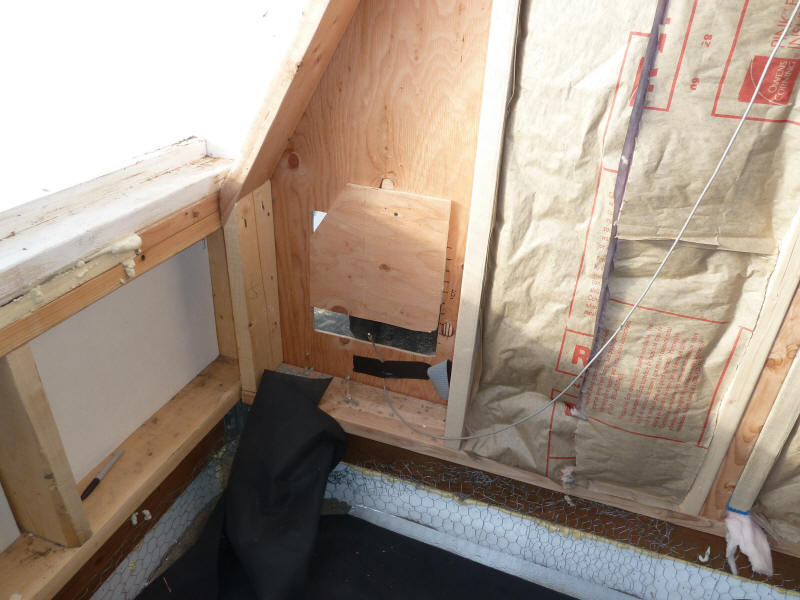
The West inlet vent.
The vents started out as 12 by 12 inch, but this
proved to be too breezy, they have been
reduced down to 3 by 12 inch.
South wall and glazing are to the left, and
vent is cut in west wall. |

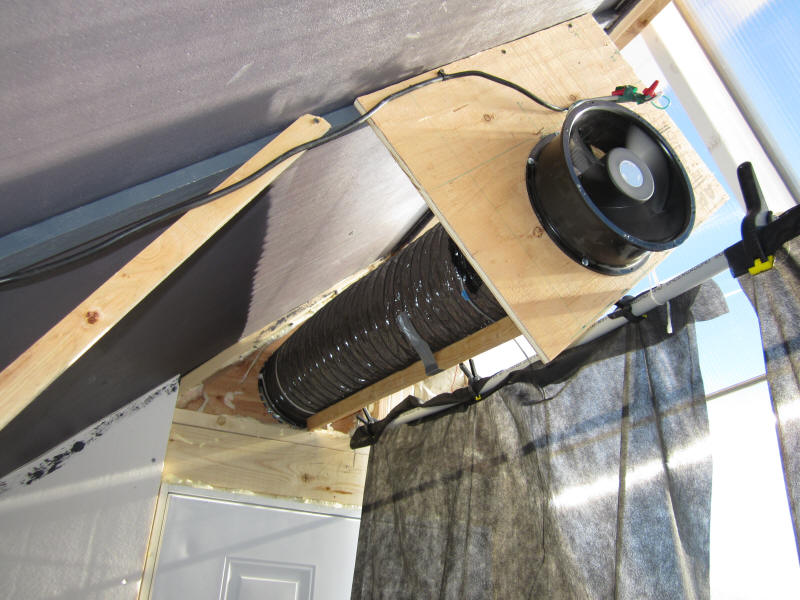
One of the two
10 inch Grainger fans
that push air out of the sunspace.
The duct is extended outside to provide
a long straight duct for more accurate
flow measurements.
The vertical weed fabric screen used
in one of the configurations is also visible. |
The fan exit duct on the outside.
The extended duct makes for more
accurate velocity/flow measurements. |
The outlets are located in the east and west ends near the peak. Each
outlet has its own 10 inch fan which is located about 4.5 ft from the
east (or west) wall. A straight flex duct runs from the fan outlet to the
wall and outside the wall, the duct is extended another 6 ft by a straight 10
inch diameter metal duct. The long straight duct run from the fan is
intended to give steady and straight flow at the outlet where velocity is
measured.
Using a fan near each end avoids hot spots in the peak area by picking up the
air in two places.
Heating Performance
This was a gang busters clear day -- not a hint of a cloud all day. Its also only a couple weeks after the Winter Solstice, so the days are short
and the sun is low in the sky (about 23 degrees at noon). The outside air
temperature was in the 20'sF. Wind was generally light.
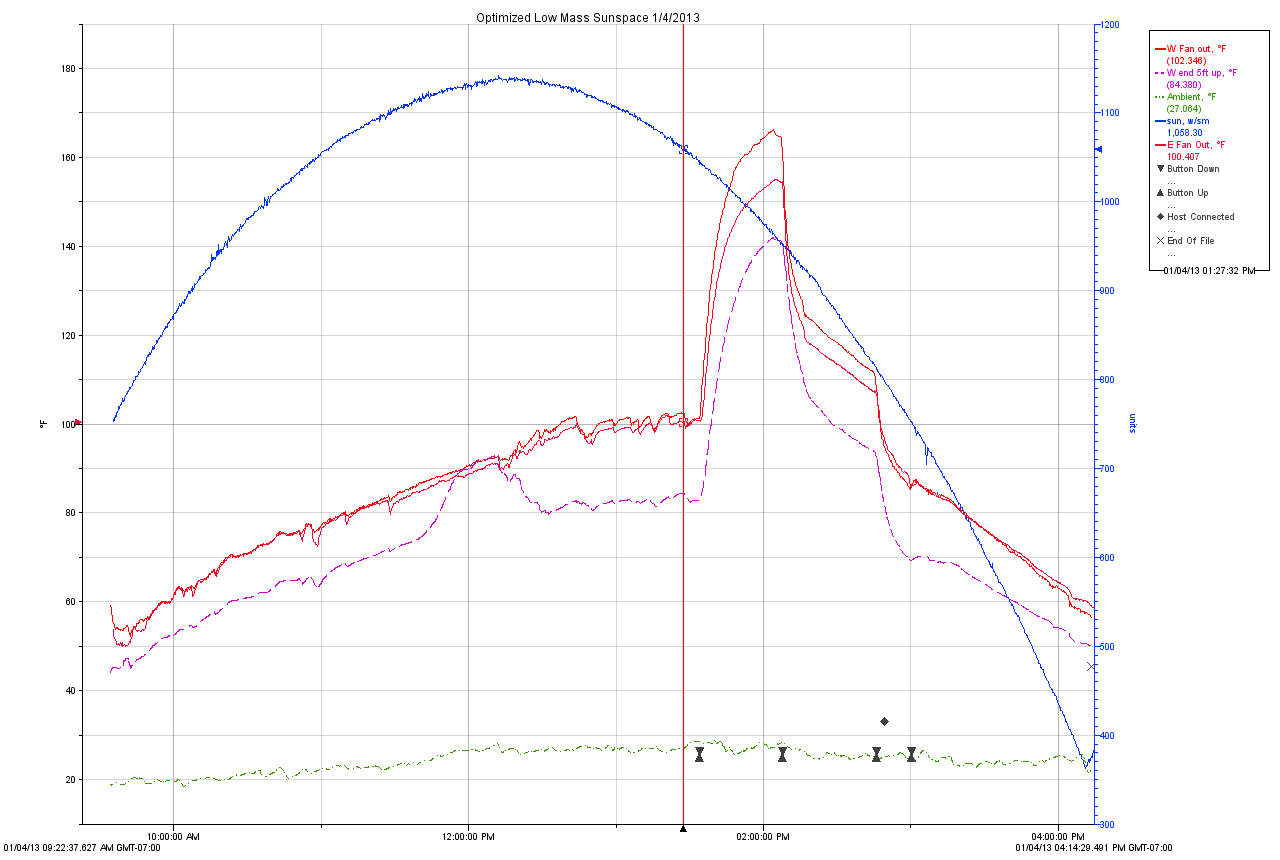
Blue solid line -- sun intensity (w/sm)
Red Lines -- Fan outlet temperatures for East and West fans (F) -- this
is the temperature of the heated air going to the house for space heating.
Green dash-dot -- Ambient temperature (F)
Purple dash line - Temperature at about the 5 ft level in the sunspace (F)
The sunspace was run with the fans on to produced heat for the house from
about 9:30am to about 1:30 pm. At this point the fans were turned off to
let the sunspace stagnate. At about 2:15 pm the fans were turned back on
again.
Total flow rate for the outlet ducts was 670 cfm (based on 614 fpm at outlet
ducts).
Heat Production
Looking at the long period when the fan outlet temperature is around 100F and
ambient temperature is about 26F, the sunspace is producing 670 cfm with a 74 F
temperature rise.
Heat Output = (100F-26F)*(670 ft^3/min)*(0.061 lb/ft^3)*(60
min/hr)*(0.24 BTU/lb-F) = 43,550 BTU/hr (210 BTU/sqft of
glazing)
This is about what a typical 60K BTU/hr gas furnace would
produce.
The heat output for the full day looks like this:
|
Time |
Tout (F) |
Tin |
Trise |
Velocity (fpm) |
Duct Area (sf) |
Flow Rate (cfm) |
Air Density (lb/cf) |
Heat Out (BTU/hr) |
|
10:00 AM hour |
61 |
19.8 |
41.2 |
600 |
1.09 |
654 |
0.061 |
23668 |
|
11:00 AM |
76.4 |
22.3 |
54.1 |
600 |
1.09 |
654 |
0.061 |
31079 |
|
12:00 PM |
90 |
26.6 |
63.4 |
600 |
1.09 |
654 |
0.061 |
36422 |
|
1:00 PM |
99.5 |
27.4 |
72.1 |
600 |
1.09 |
654 |
0.061 |
41420 |
|
2:00 PM |
99.5 |
28.3 |
71.2 |
600 |
1.09 |
654 |
0.061 |
40903 |
|
3:00 PM |
87 |
24.8 |
62.2 |
600 |
1.09 |
654 |
0.061 |
35732 |
|
4:00 PM |
64 |
25.1 |
38.9 |
600 |
1.09 |
654 |
0.061 |
22347 |
| |
|
|
|
|
|
|
|
|
| Total |
|
|
|
|
|
|
|
231570 |
So, about 232K BTU heat output for the day -- about equivalent to 3.6 gallons
of propane burned in a 70% efficient furnace.
So, even this modest size sunspace can produce a lot of useful heat on a
sunny winter day -- even for the shortest days of the year.
Efficiency
One difficulty with making efficiency estimates from the performance curve
above is that the even though this is a very low mass sunspace, it apparently
has enough thermal mass that its outlet temperatures and heat output lag a bit
behind changes in sun intensity. You can see this in the time period from
about 12:30 pm to about 1:30 pm -- in this time period, the output temperature
and heat output are nearly constant at just over 100F, but the sun intensity is
dropping from about 1130 w/sm down 1040 w/sm. I believe that if the
sunspace had even lower thermal mass, it would react more quickly to solar
changes.
This effect also shows up if you calculate efficiencies for the morning vs
afternoon. In the morning, the sunspace outlet temperature is lagging
behind the sun level increases and producing lower outlet temperatures than it
would if the sun just stayed steady at one level. In the afternoon the
sunspace outlet temperature drops more slowly than the drop in sun level because
the sunspace mass is losing heat and keeping the temperatures up. So, in
the morning the apparent efficiencies are around 45% while in the afternoon they
are more like 71% -- these are not really valid efficiency numbers in that
conditions are not steady, but they illustrate the lag effect.
To get the best idea of efficiency that I could, I looked at the solar input
and heat output at just after 1 pm:
Solar input: based on 1099 w/sm sun and 208 sf
glazing is 72, 490 BTU/hr
Heat output: based on an outlet temperature of
99.4 F and inlet of 26F and with flow rate of 670 cfm heat output is:
Heat Out= (99.4F - 26F)(670 ft^3/min)(60 min/hr)(0.061 lb/ft^3)(0.24
BTU/lb-F) = 43,200 BTU/hr
Efficiency is then 43200 / 72490 = 59.6%
This is very good for a solar air heating collector.
So, how does this compare with a good commercial collector under the same
conditions?
Using this
Collector Efficiency Calculator
and
Collector: Heliodyne Gobi water heating collector (a
very good collector)
Ambient Temperature: 26F
Sun Intensity: 1099 w/sm (348 BTU/sf-hr)
Average Collector Temperature: (99.4F + 26F) /2 =
62.7 F
Efficiency is: 61.3%
The Sunsiaray air collector under the same conditions
comes out a 42%
So, under the same operating conditions, the low thermal
mass sunspace efficiency is equivalent to, or better than commercial active
collectors, and you still get all the other benefits that sunspaces offer.
Note that the sunspace efficiency benefits from the low
inlet air temperature -- this makes the average collector temperature lower and
reduces glazing losses. But, the Heliodyne calculation gets the same
benefit, so the comparison is an apples to apples one.
Efficiency under other conditions
From the above, we have an efficiency of 59% with 26F ambient and inlet
temperature, 99F exit temperature, and 1100 watt/sm ( 349 BTU/sf-hr).
This is a rather odd operating condition with the inlet air so cold. It
raises the question of what would the efficiency (and output per sqft) be for
more normal usage conditions?
One way to work this would be to say that since the efficiency of for the
test condition nearly matches the Heliodyne collector we compared it to, so just
adopt the Heliodyne collector efficiency curve over its full span. This is
perhaps doubtful, but flat plate collectors do tend to have similar curves, so
this approach may be in the ball park. If you do this, then: the Heliodyne
collector efficiency curve has an intercept value of 0.726 and a slope value of
-1.071 BTU/hr-sqft. Adjusting this down a little for our collector because
its efficiency was not quite as high, you get an intercept of 0.705 and slope of
-1.071. Using that efficiency curve for our sunspace, here are
efficiencies and output per sqft for a few conditions.
| Condition |
Ambient
(F) |
Inlet
(F) |
Outlet
(F) |
Absorber
(F) |
Temp Rise(F) |
Sun (w/sm) |
Efficiency
(%) |
Heat Out (BTU/sqft) |
| Test -- day 1 (above) |
26 |
26 |
99 |
62.5 |
73 |
1100 |
59.3 |
207 |
| As test, with more
realistic inlet temp |
26 |
65 |
110 |
87.5 |
45 |
1100 |
51.6 |
180 |
| Sunny winter day |
35 |
65 |
110 |
87.5 |
45 |
1000 |
52.8 |
167 |
| sunny spring/fall day |
50 |
65 |
110 |
87.5 |
45 |
1000 |
57.8 |
183 |
| Not so sunny winter day |
35 |
65 |
110 |
87.5 |
45 |
600 |
40.9 |
78 |
| Not so sunny spring/fall
day |
50 |
65 |
110 |
87.5 |
45 |
600 |
49.4 |
94 |
To look at other conditions, just use
this calculator and put in 0.705 for
the Efficiency Curve Intercept, and -1.071 for the Efficiency Curve Slope.
For the Average Collector Temperature, put in the average of your inlet
temperature (the return air coming from the house) and the estimated outlet
temperature. Clicking Calculate will give you the estimated
efficiency and the collector output per sqft of glazed area -- so, the "Not so
sunny spring day" for our 208 sf collector output would be (208 sf)(93 BTU/sf) =
19,340 BTU/hr.
Another approach would be to do a simple calculation of the sunspace
collector solar gain and the losses through the glazing and use the test
conditions to estimate the R value of the glazing.
Solar heat gain to the collector (sun
intensity)(glazed area)(Glazing transmittance)
For our test this would be (349 BTU/sqft-hr)(195 sqft)(0.80) = 54444 BTU/hr
I used 195 sf for the glazed area, because we want the
actual glass area for this, not including collector frame.
The 0.8 transmittance is from this
ref for 10 mm twinwall...
Heat loss from the glazing is (glazed area)(Tcollector -
Tambient) / (Rglazing)
For our test, and using the glazing published R value, this would be (195 sqft)(99F
- 26F) / (R1.79) = 7952 BTU/hr
This gives a net heat output of 54444 BTU/hr - 7952 BTU/hr
= 46492 BTU/hr
The actual heat output per hour was 43200, so the
estimate is about 8% high -- the R value could be dropped to (1.79)(0.92) = 1.65
to account for this.
Either of these two methods is probably OK for doing reasonable estimates --
if you know of any better methods, please let me know.
Things to keep in mind are that this test was done on a pretty highly optimized
sunspace -- tight construction, double glazing, insulated everywhere (floor,
ceilings, walls, ...), and with all absorbing surfaces painted dark. If
you decide to compromise on any of these to meet other goals, then the heat
output and efficiency will drop some. The test of the
non-optimized
sunspace might be used as a guide for how much.
Stagnation
The fans were turned off at about 1:30 pm just to see what the temperature
would do with the sunspace stagnated. The inlet vents were blocked with
some (somewhat leaky) fiberglass insulation and the outlets were left open
-- so, there was likely some thermosyphon flow through the sunspace even though
the fans were off.
The temperature in the outlet duct gets up 166 F just before the fans were
turned back on at 2:15 pm -- it probably would have climbed a few more degrees.
The diagram below shows air and surface temperatures during the stagnation
period.
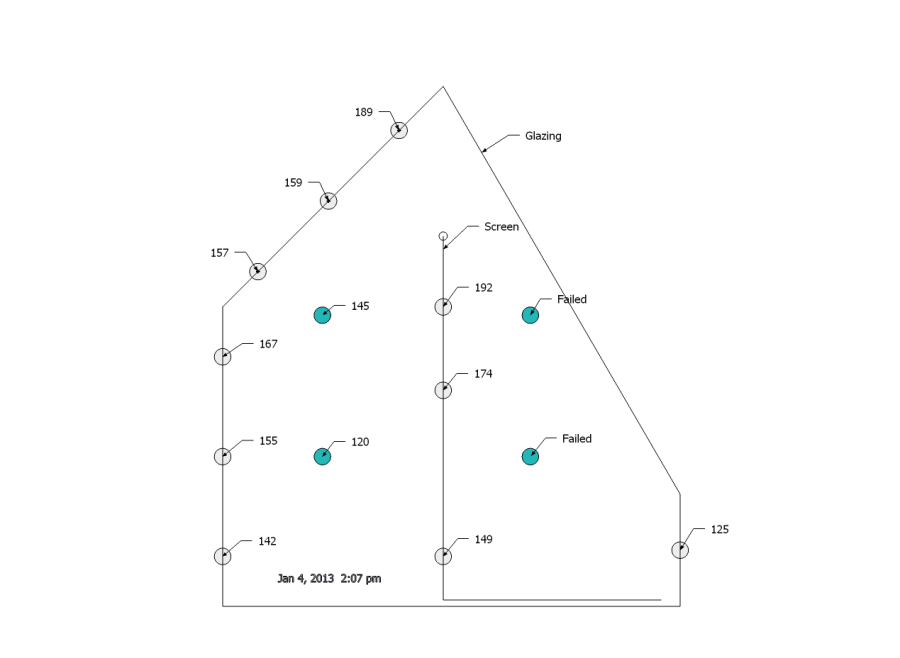
Temperatures at 2:07 pm -- fans not running, inlets plugged.
Stagnated sunspace.
The south indoor outdoor thermometer and overheated (temporarily) and stopped
providing readings.
So, not surprisingly, it gets pretty warm pretty fast with no
airflow. While these temperatures are not dangerously high, some
form of venting would be a good idea when the space heating fans are not
running. You probably also do not want to lock Fido or the kids in the
sunspace when its stagnated.
The odd looking double slope to the cool down curve after the fans were
turned back on is because I initially forgot to pull out the fiberglass plugs I
put in the inlet vents. They came out around 2:45 pm, and the cool down
slope steepens reflecting more air circulation.
Temperature Environment in Sunspace
Glazing Thermal Images
These pictures need to be clicked on to see the temperature labels.
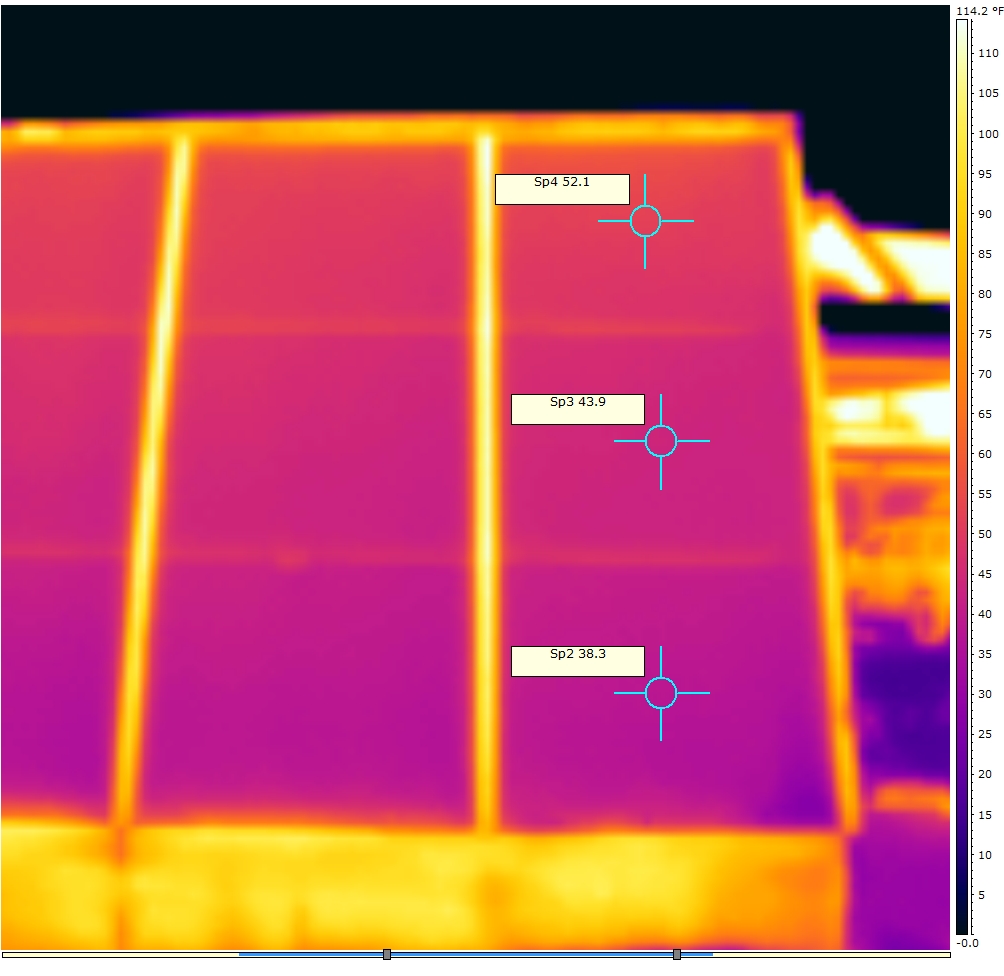
Outside of glazing.
Emissivity 0.95.
|
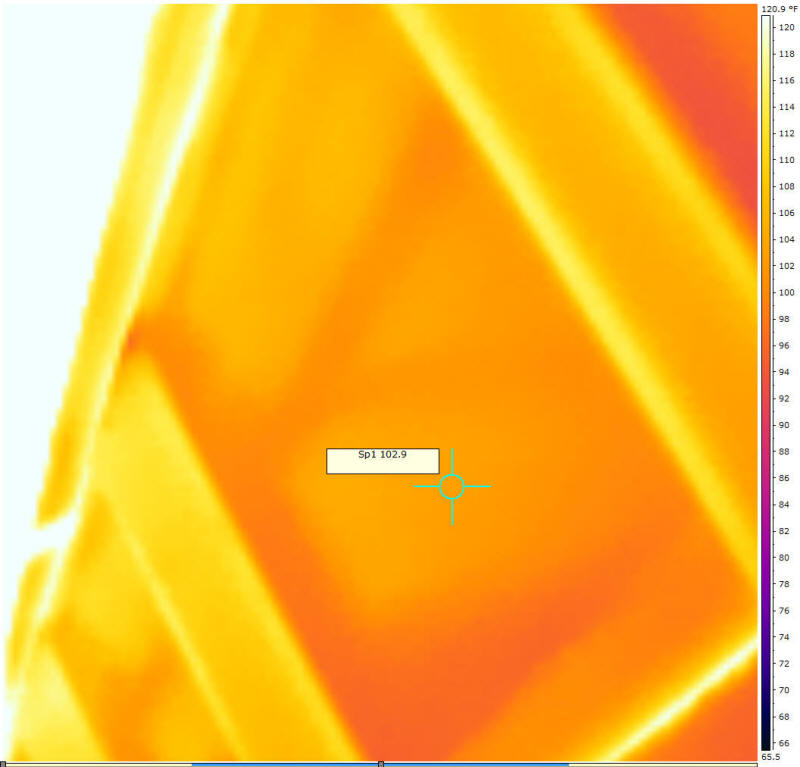
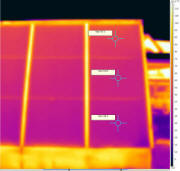
Inside of glazing -- top.
Top part of glazing panel. |
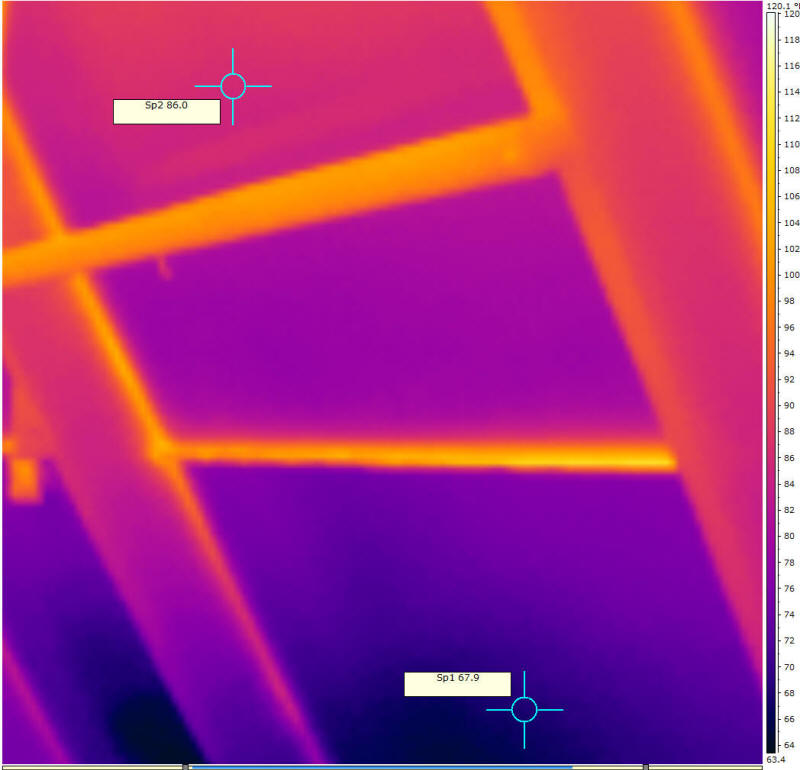
Inside of glazing - bottom.
Lower part of glazing panel. |
Glazing pictures at 1:46 pm.
The left picture above is of the outside of the glazing with temperatures
ranging from 38F at the bottom to 52F at the top.
The center picture is of the inside of the glazing near the top (the space is
confined enough that I can't get the whole panel in). The temperature is
103F on the inside surface, so the temperature difference across the twinwall
glazing is about 103F - 52F = 51F.
The right picture is of the inside of the glazing near the bottom with a
temperature of 68F. Temperature difference inside outside is 68F - 38F =
30F.
At this time, the conditions are:
Ambient temperature 28F
Fan outlet temperature 99F
Air temperature inside near glazing at bar 1/3 of way up
86F
Sun 1125 w/sm
Solar input 73K BTU/hr
Heat output = 41.5K BTU/hr
Losses = 73K - 41.5K = 31.5K BTU/hr
Just as a side note, the two Dayton fans use a total of
54 watts to move the heated air that is providing 12,300 watts in heat output --
a COP of 227 !
Just as an Interesting Item
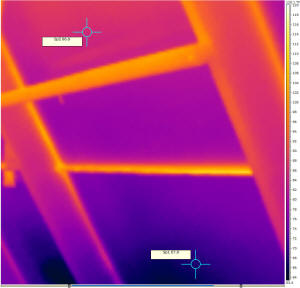
I took some IR pictures of two other nearby collectors that face the same way
and are at the same tilt --
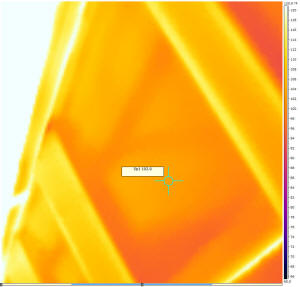
The sunspace glazing. |
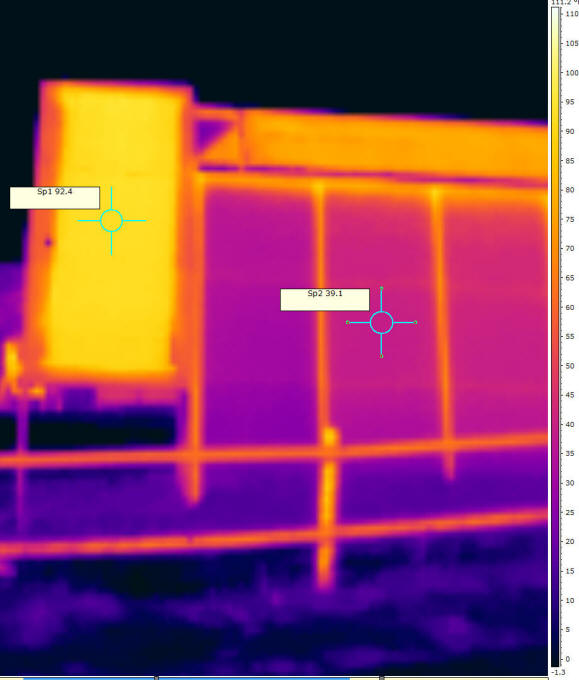
The left hot patch at 92.4F is the pool heating collector for the
OTS
solar water heating system prototype -- it is unglazed.
The right collector at 39.1F is the water heating collector for
the
Solar Shed project -- glazed with twinwall polycarbonate.
The temperature of the water circulating in the two collectors is not
known. |
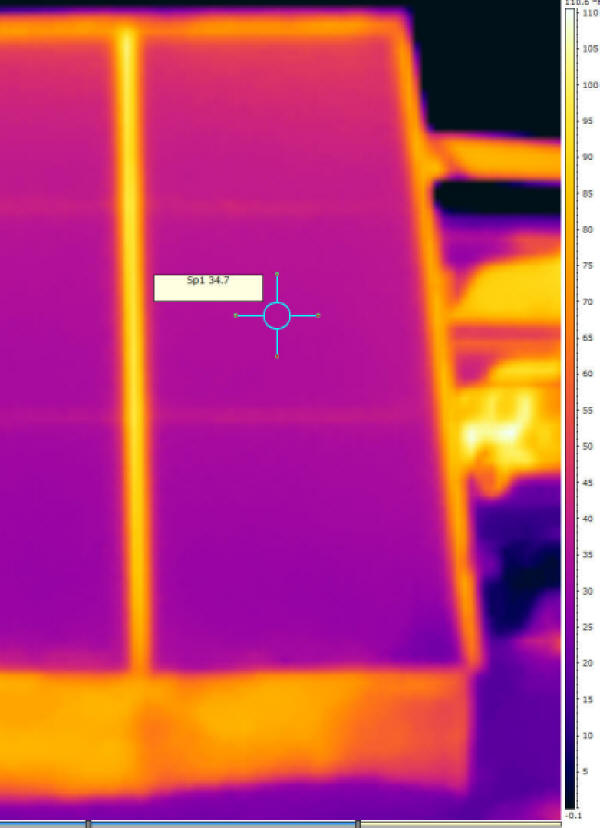
The left picture is the sunspace glazing at 3 pm with an outside glazing
surface temperature
of 35 F in the center.
The picture to the right has two collectors.
The right is the solar shed water heating collector with
twinwall glazing. Its outside temperature is similar to the sunspace
collector (4F warmer).
The collector to the right is an unglazed pool heating
collector being used as the prototype for the Off The Shelf DIY water heating
system. Its outside temperature is 92F.
All three collectors were operating at the time.
Conditions
Inside the Sunspace
Back of sunspace (north of the vertical fabric curtain):
You have to click on these pictures to see the temperature labels
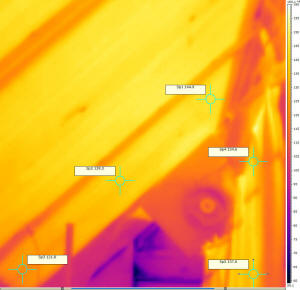
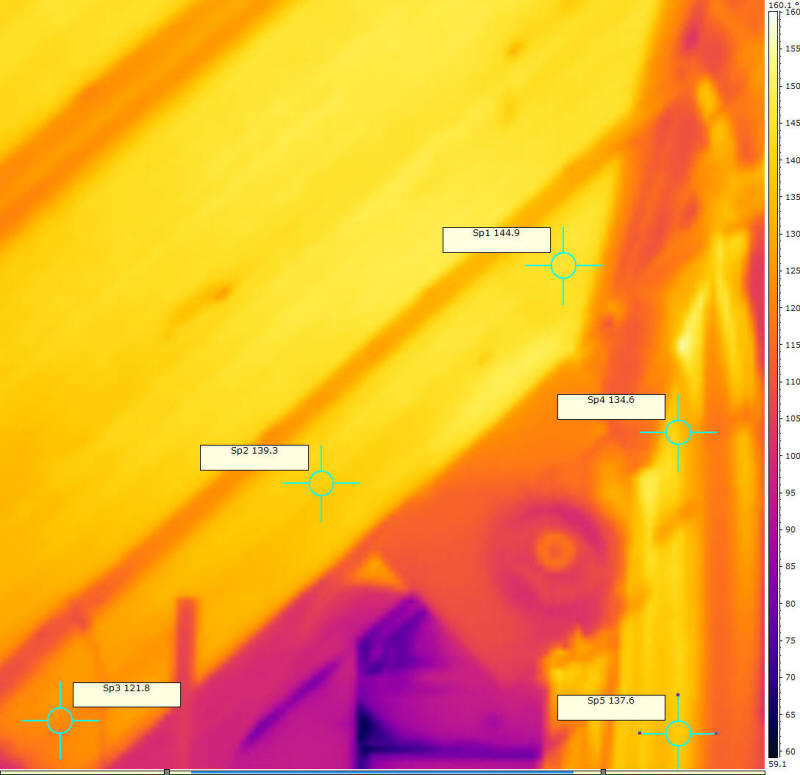
North roof behind fabric curtain.
Curtain is visible to right.
East fan is the circular item. |

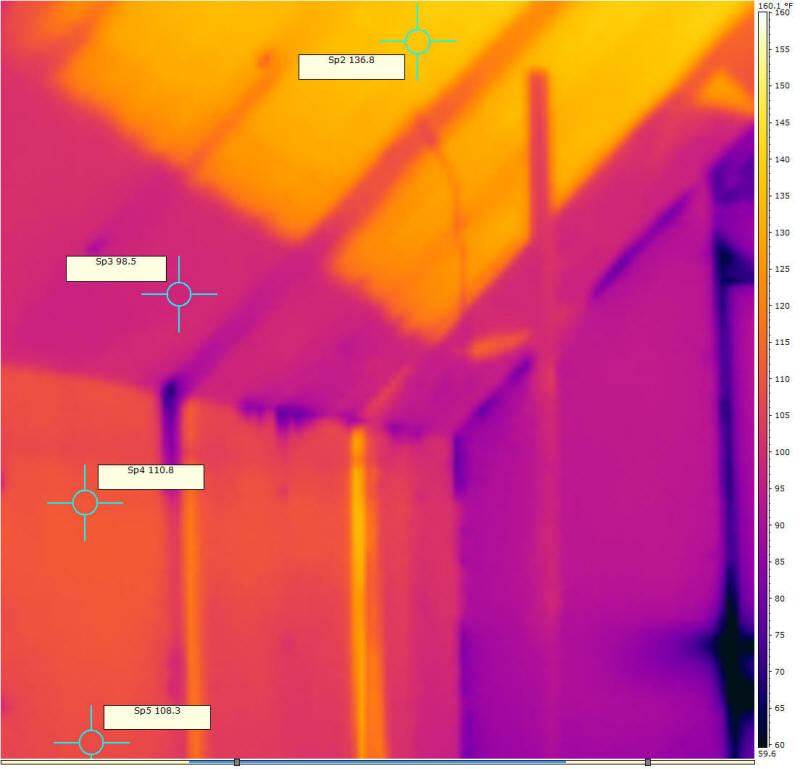
North wall and north ceiling.
Lower part of north ceiling and all
of North wall are shaded by the fabric curtain. |
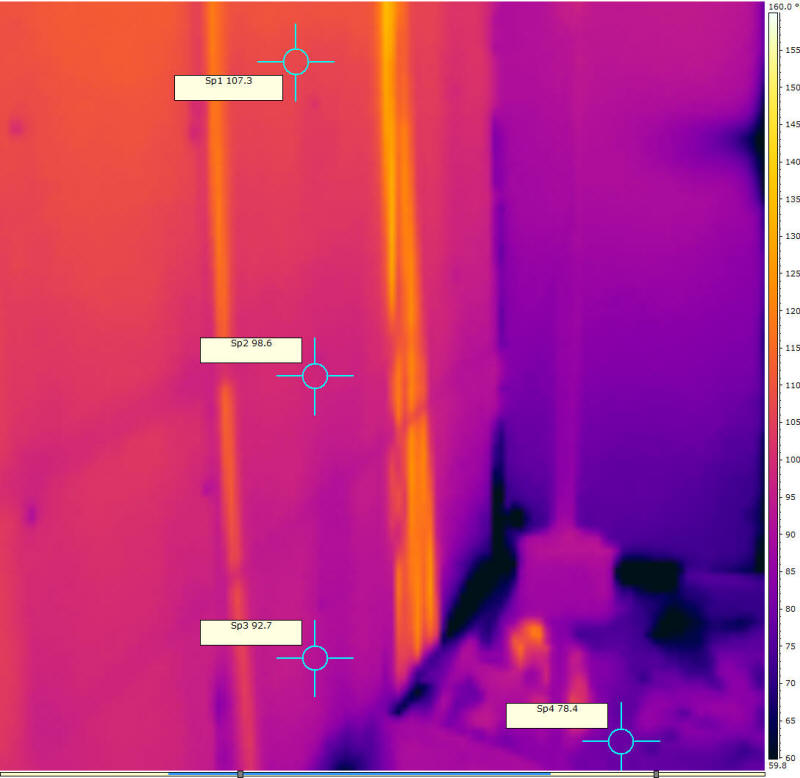
Lower part of North wall.
Fabric curtain out of view to the right. |
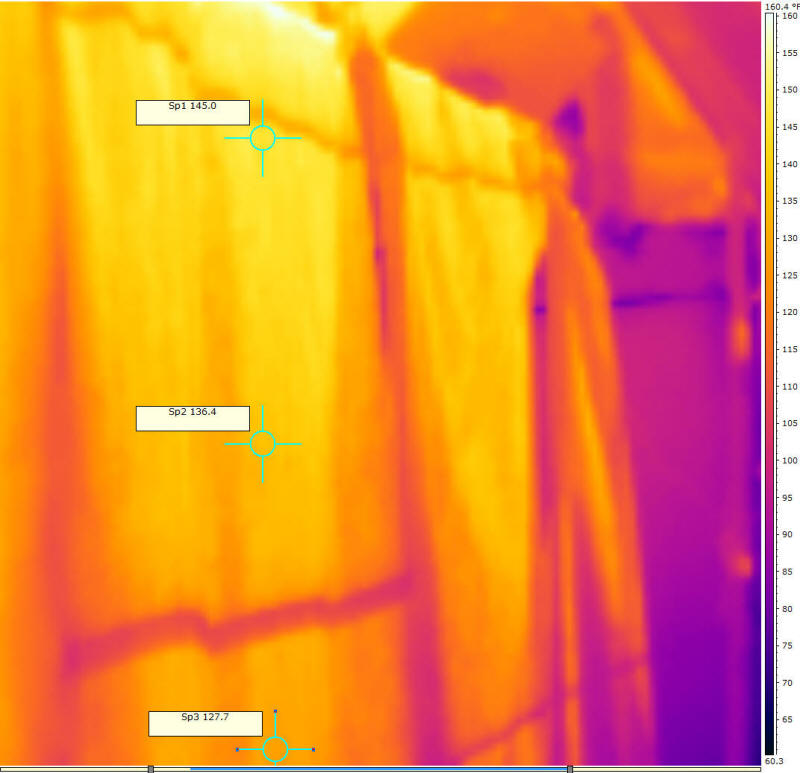
All thermal images were done with a temperature range of 60F to 160F and emissivity of 0.95.
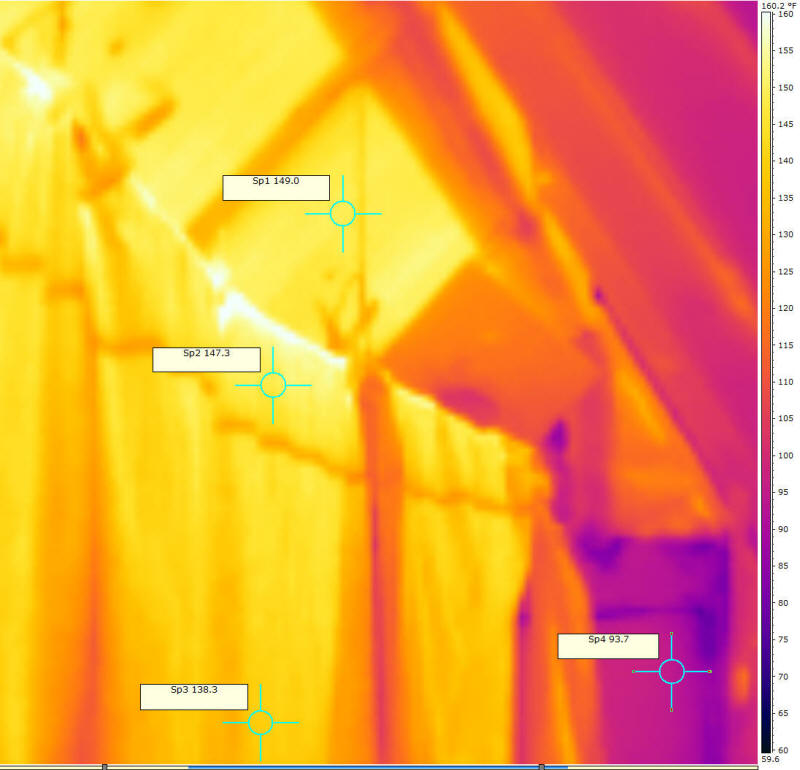
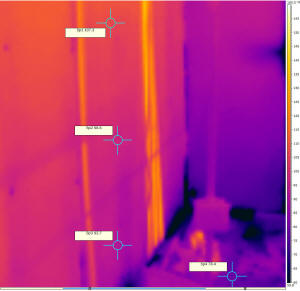
Front of sunspace (south of the vertical fabric curtain):
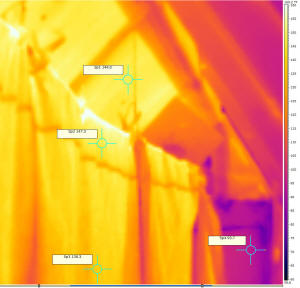
South sunspace - top.
Top temp label is on north roof above curtain.
Two temperature labels on the curtain. |
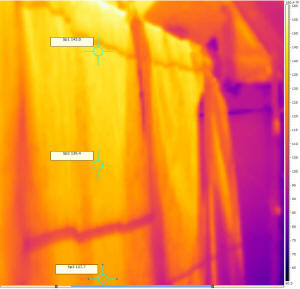
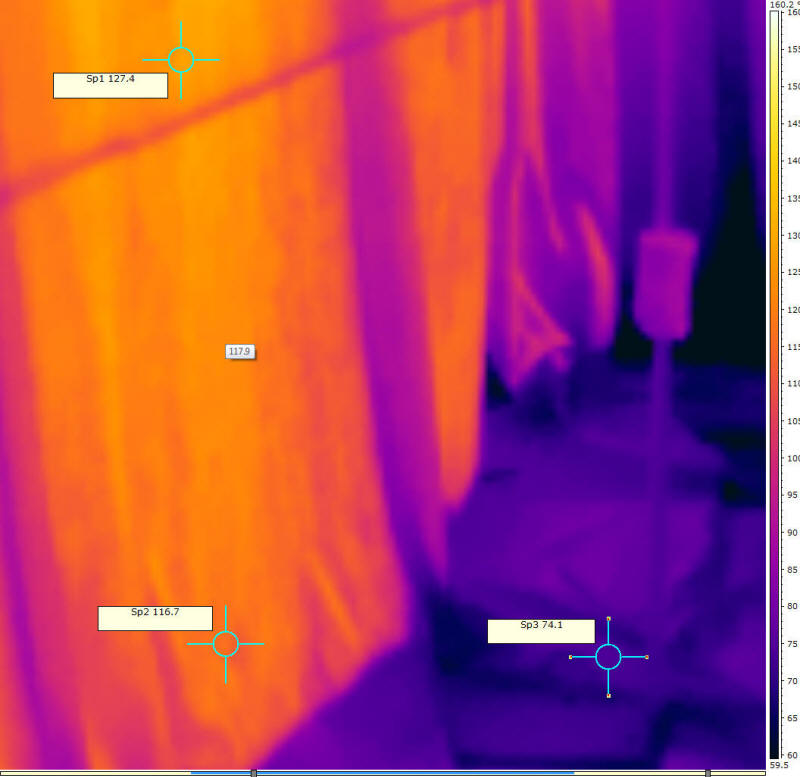
South face of curtain upper half.
Temperature labels are on the curtain face. |
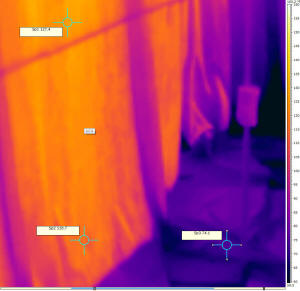
South face of curtain -- lower part.
Purple part is curtain fabric along floor. |
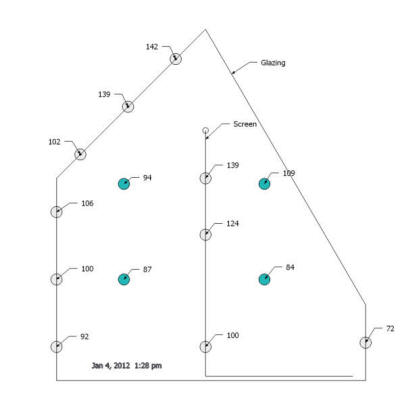
Air and Surface Temperatures
In these pictures, the grey filled circles are surface temperatures (taken
with an IR temperature gun), and the teal filled circles are air temperatures
taken with a couple indoor/outdoor thermometers.
These readings are taken in a north-south plane about half way between the
east and west ends.
.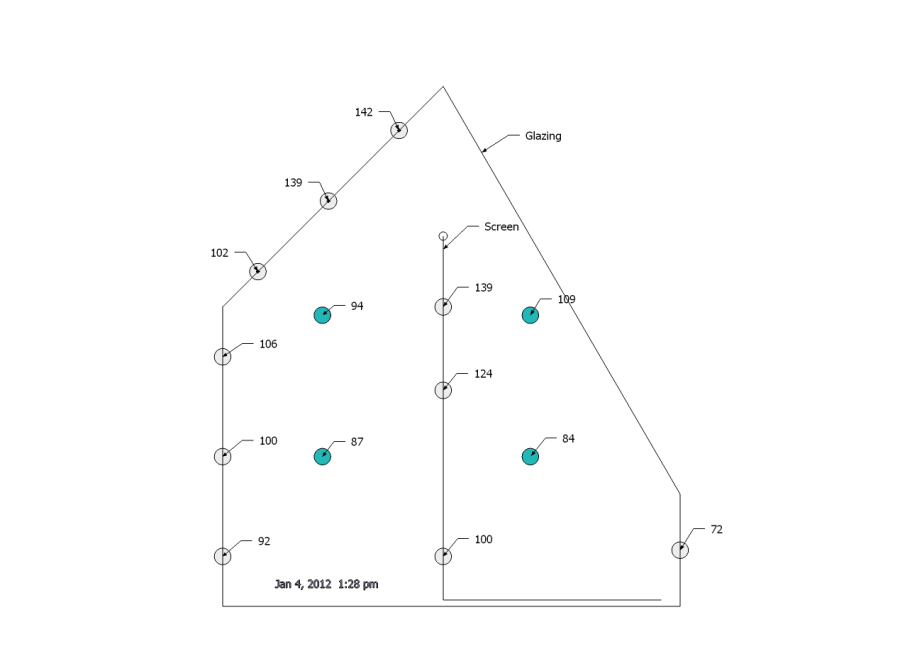
Temperatures at 1:28 pm with both fans operating and full sun.
Just after solar noon.
Comments
Got comments, Questions, Suggestions --
go here...
Gary
January 10, 2013